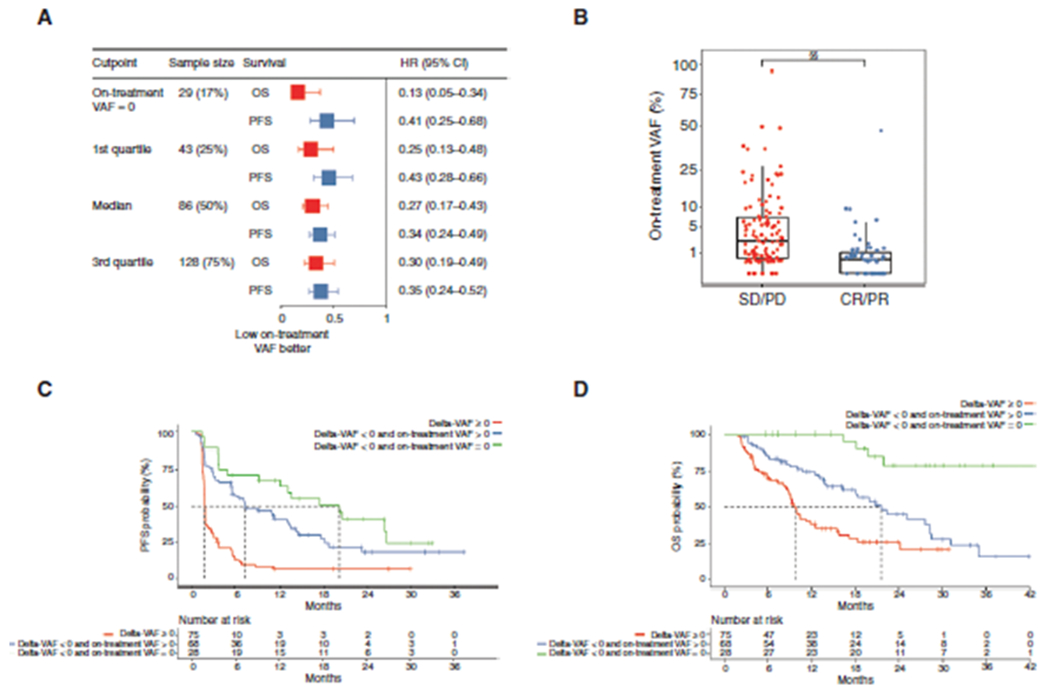
Figure 2.

A, Forest plot of PFS and OS by on-treatment VAF. The best OS was observed in patients with complete ctDNA clearance on treatment. B, RECIST responders and nonresponders had significantly different on-treatment VAF (P < 0.0001). C and D, Kaplan–Meier analysis of PFS (C) and OS (D) in the discovery cohort stratified by delta-VAF and on-treatment VAF. Significant differences were observed among groups (P < 0.0001). §§, P < 0.00001.
