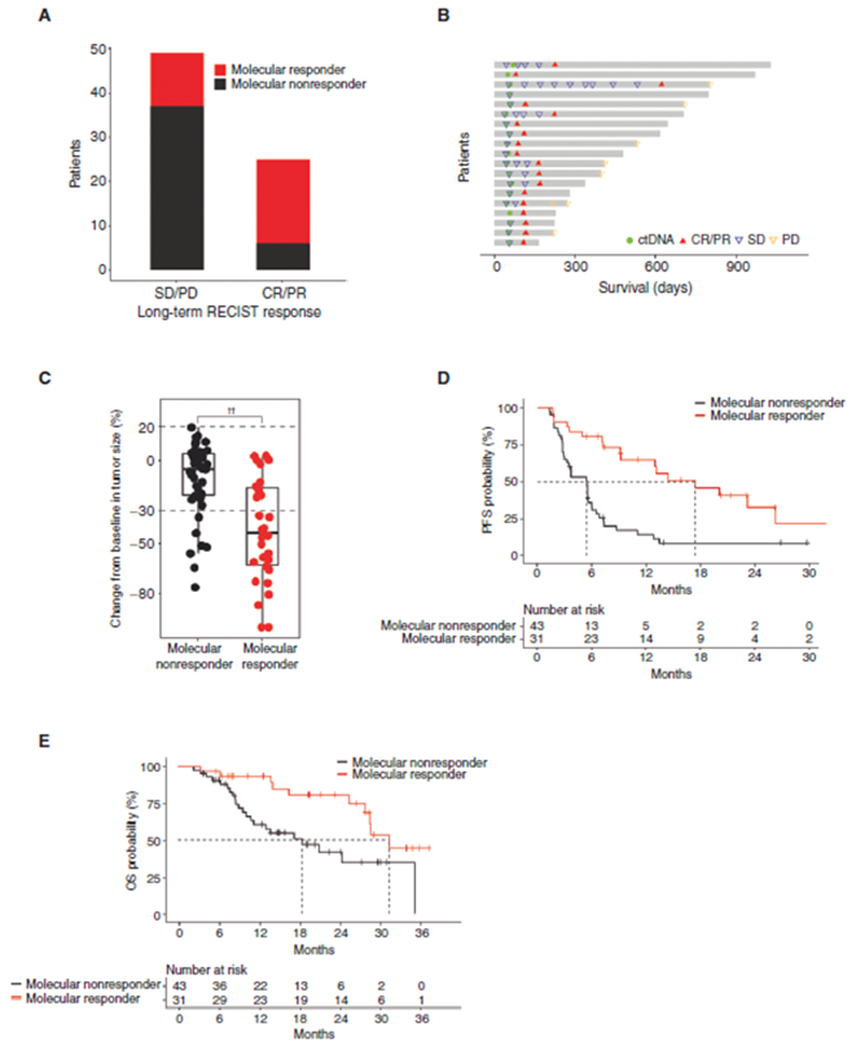
Figure 4.

A, Number of molecular responders and molecular nonresponders (per ratio approach) with eventual RECIST response. A higher percentage of eventual radiologic responders was initial molecular responders (19/25, 76%) than the percentage of eventual radiologic nonresponders who were initial molecular responders (12/49, 24%; P < 0.0001, Fisher test). B, Swimmer plot of 14 patients with initial SD who were molecular responders and eventually had a radiologic response. The median time to radiologic response was 114 days from starting of the therapy, a median of 59 days later than the ctDNA assessment. C, Tumor shrinkage from baseline was significantly greater in molecular responders than molecular nonresponders (per ratio approach; P < 0.0001). The horizontal bar represents the mean, box represents the 25th and 75th percentiles, and whiskers ± 1.5 × interquartile range. D and E, Kaplan–Meier analysis of PFS (D) and OS (E) of patients who had RECIST and molecular response assessments stratified by molecular response (per ratio approach). PFS and OS were significantly longer in molecular responders than in molecular nonresponders (HR, 0.31; 95% CI, 0.17–0.56; P = 0.0001 and HR, 0.36; 95% CI, 0.17–0.79; P = 0.008, respectively). ††, P < 0.0001.
