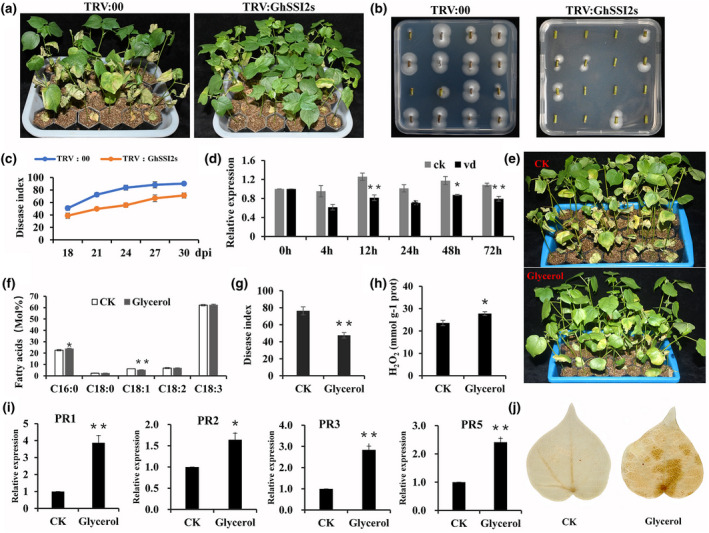
FIGURE 3.

GhSSI2s‐silenced plants conferred enhanced resistance to V erticillium dahliae. (a) Disease symptoms of TRV:00 and TRV:GhSSI2s plants inoculation with V. dahliae at 24 days post inoculation (dpi). (b) Fungal recovery experiments in TRV:GhSSI2s and control plants 4 days after recovery. (c) The disease index of the TRV:00 and TRV:GhSSI2s plants. The values were the means ± SE for three independent experiments (30 seedlings in each experiment). (D) Quantitative reverse transcription PCR (RT‐qPCR) analysisof expression of GhSSI2s following inoculation with V. dahliae in resistant ND601. GhUBQ14 was used as an internal control. The values were the means ± SE for three biological replicates (** p< 0.01, Student’s t test). (e) Disease symptoms of cotton plants treated with 100 mM glycerol following inoculation with V. dahliae. Photographs were taken at 20 dpi.(f) Detection of fatty acid composition in the glycerol‐treated plants. The values were the means ± SE for three biological replicates (*p < 0.05, **p < 0.01, Student’s t test). (g) Disease index of cotton plants after glycerol treatment at 20 dpi. Error bars were SE calculated from threebiological replicates, each containing 35 plants. (h) Measurements of the H2O2 contents in the glycerol‐treated plants. The values were the means ± SE for three biological replicates (* p< 0.05, Student’s t test). (I) RT‐qPCR analysis of PR gene expressionin control and glycerol‐treated plants. The values were the means ± SE for three biological replicates (*p < 0.05, **p < 0.01, Student’s t test). (J) Detection of H2O2 accumulation in the control and glycerol treatment cottons via 3,3′‐diaminobenzidine staining
