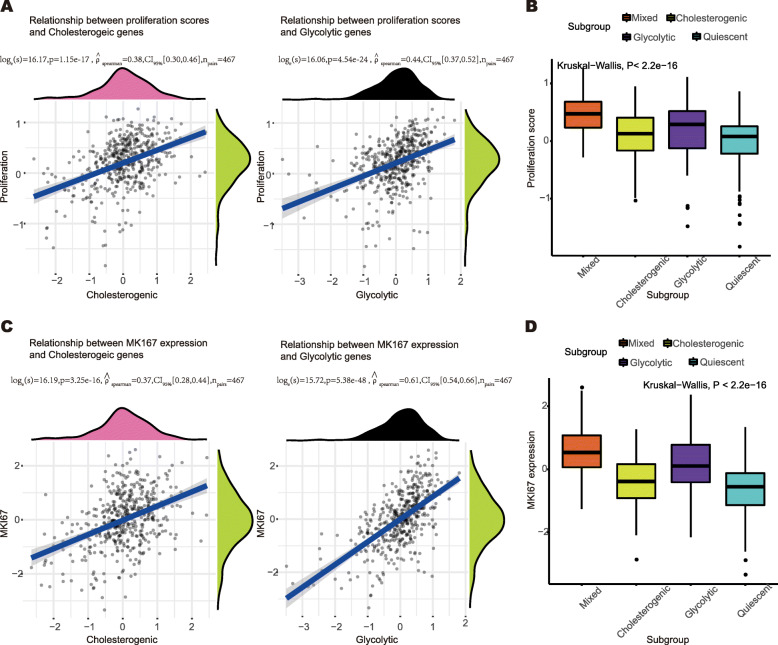
Fig. 4.
The proliferation status across metabolic subgroups. A Scatter plot depicting the correlation between the proliferation score and median expression of cholesterogenic genes (left) and glycolytic genes (right). The Spearman’s test P values are shown. B Boxplot illustrating proliferation score across metabolic subgroups. Kruskal-wallis test P value is shown. C Scatter plot depicting the correlation between the MKI67 expression and median expression of cholesterogenic genes (left) and glycolytic genes (right). The Spearman’s test P values are shown. D Boxplot illustrating the MKI67 expression across metabolic subgroups. Kruskal-wallis test P value is shown. P < 0.05 is defined as statistically significant

