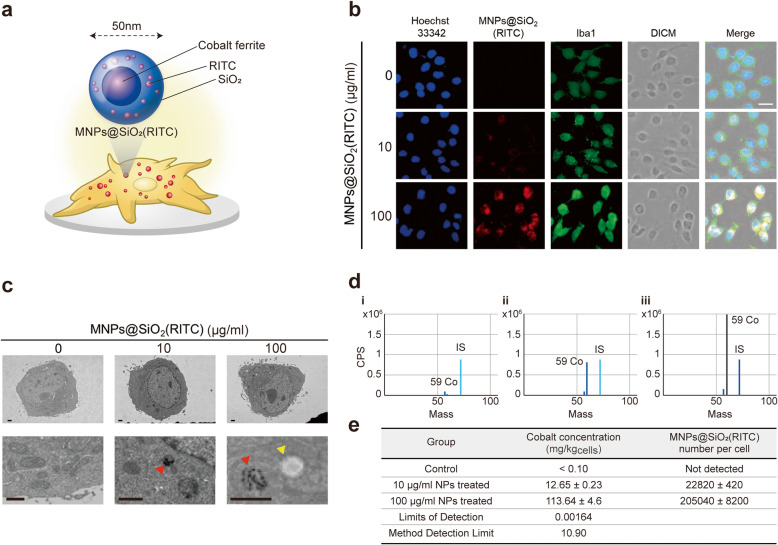
Fig. 1.
TEM analysis of MNPs@SiO2(RITC)-treated BV2 cells. a Schematic representation of the MNPs@SiO2(RITC) composition. b Immunostaining image of Iba1 (green), MNPs@SiO2(RITC) (red), and the nucleus (blue). Scale bar = 20 μm. c Representative TEM images of MNPs@SiO2(RITC)-treated BV2 cells. Magnified images are presented in the bottom panels. The red arrow head indicates MNPs@SiO2(RITC) in the cell, and the yellow arrow head indicates a granular structure. Scale bar = 1 μm. d ICP-MS peak of the cobalt ion in the control and MNPs@SiO2(RITC)-treated microglia. IS = internal standard. e Quantification of the cobalt concentration and MNPs@SiO2(RITC) particles in each MNPs@SiO2(RITC)-treated cell

