Fig. 3.
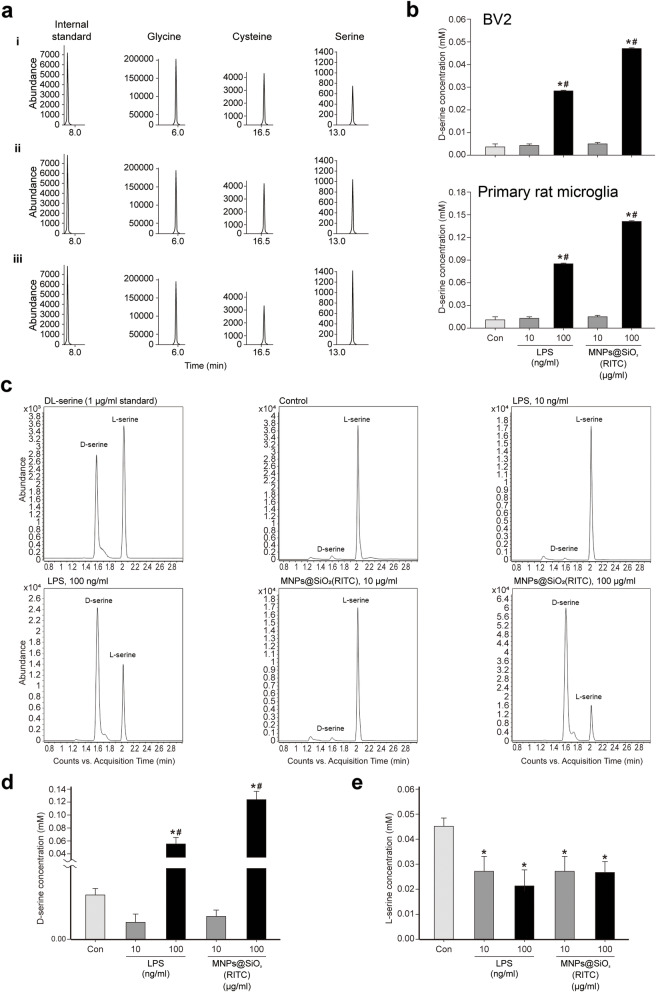
Analysis of the changes in serine family amino acids and quantification of L-and D-serine secretion by BV2 cells treated with MNPs@SiO2(RITC). a SIM chromatograms of glycine, cysteine, and serine in (i) control (ii) 10 µg/ml, and (iii) 100 µg/ml MNPs@SiO2(RITC)-treated microglia. The internal standard was norvaline. b Quantitative analysis of D-serine in the medium of MNPs@SiO2(RITC)-treated microglial cells (top panel: BV2 cells, bottom panel: primary rat microglia) using an enzyme-based system. Data were normalized to the control and represent the mean ± SD of three independent experiments. *p < 0.05 vs. non-treated control. c Multiple reaction monitoring peaks of L- and D-serine in the control, 10 µg/ml, and 100 µg/ml MNPs@SiO2(RITC)- and 10 and 100 ng/ml LPS-treated primary rat microglia. Quantification and statistical analysis of L- d and D-serine e in control, 10 µg/ml, and 100 µg/ml MNPs@SiO2(RITC)- and 10 and 100 ng/ml LPS-treated primary rat microglia. *p < 0.05 vs. non-treated control. #p < 0.05 vs. 10 µg/ml MNPs@SiO2(RITC)-treated cells

