Fig. 4.
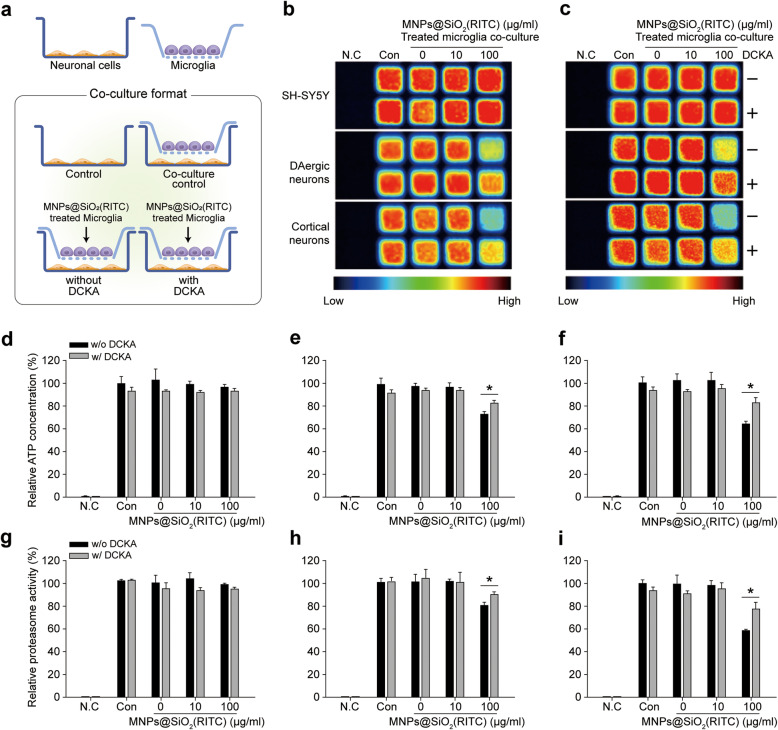
Evaluation of the intracellular ATP level and proteasomal activity in MNPs@SiO2(RITC)-treated microglia-cocultured neurons. a Schematic representation of the primary rat microglia and neuronal cell coculture system. Luminescence images of the ATP level b and proteasomal activity c. N.C.: non-treated control control; Con: neuronal cells only; DCKA: 5,7-dichlorokynurenic acid. Plus and minus signs indicate with or without DCKA treatment. Statistical analysis of ATP levels in d SH-SY5Y, e DAergic, and f cortical neurons. Statistical analysis of proteasomal activity in g SH-SY5Y, h DAergic, and i cortical neurons. *p < 0.05 vs. without DCKA. The experiments were repeated three times independently, and a representative result is shown

