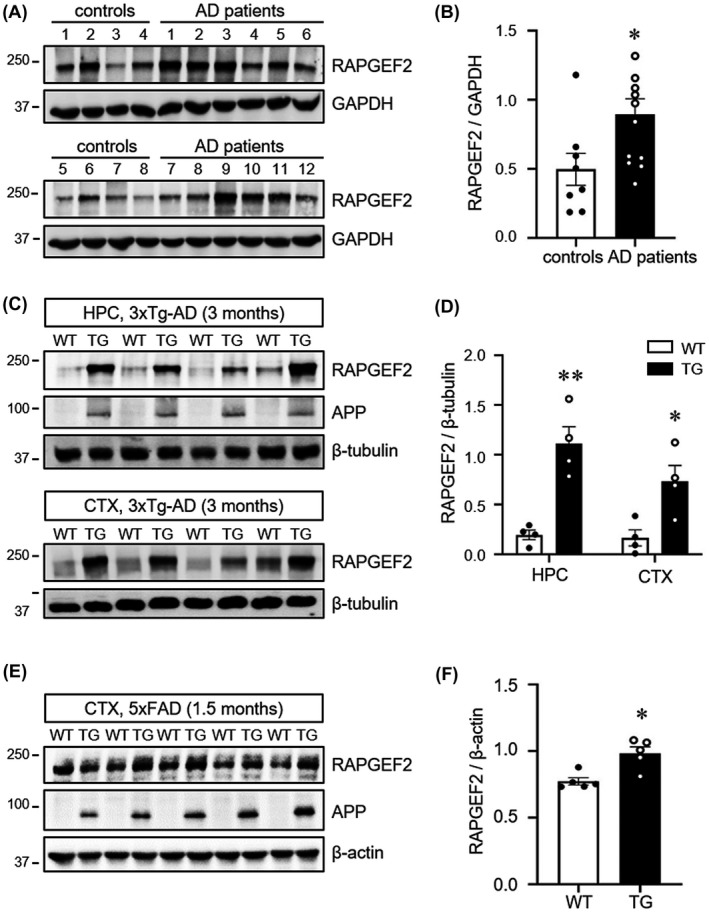
FIGURE 1.

Elevated levels of RAPGEF2 in the post‐mortem human AD hippocampus and AD mouse brains. A, Post‐mortem human hippocampal tissue from non‐patients (controls) and AD patients was subjected to western blot analysis for the RAPGEF2 levels. B, Quantification of RAPGEF2 levels normalised to GAPDH (control, n = 8; AD patients, n = 12). C, RAPGEF2 expression levels were analysed at 3 months of age in the hippocampus (HPC) and cortex (CTX) of wild‐type (WT) and 3xTg‐AD mice (TG). D, Quantification of RAPGEF2 levels in the HPC and CTX of 3‐month‐old WT (n = 4; males), and TG mice (n = 4; males). E, RAPGEF2 expression levels were analysed in the cortical lysates of 1.5‐month‐old WT and 5xFAD (TG) mice. Note that the levels of APP are markedly higher in the TG mice. F, Quantification of RAPGEF2 levels normalised to β‐actin (n = 5; 4 males, 1 female). All data are shown as the mean ± SEM. **p < 0.01, *p < 0.05; two‐tailed unpaired Student's t‐test
