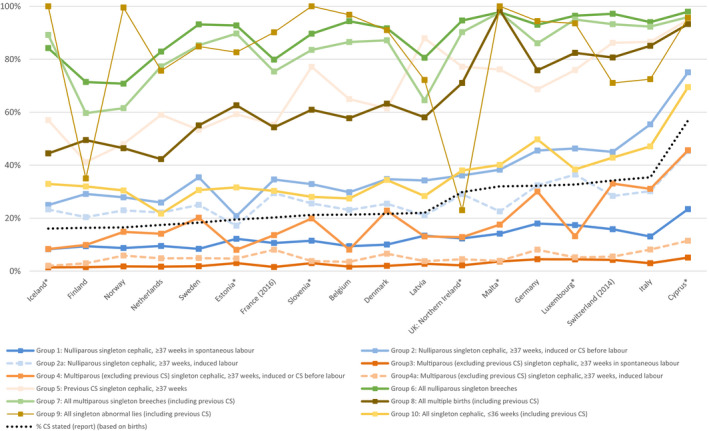
Figure 2.

Caesarean section (CS) rate in the Ten‐Group Classification System (TGCS) groups among women delivering live or stillborn infants by country, ordered by their overall caesarean rate, in 2015. Caesarean rates in each TGCS group are presented using a different coloured marker and connected across countries by a similarly coloured line. This makes it possible to compare slopes of the line for each group with the overall caesarean rate, represented in the figure as a dotted black line, to assess concordance in country rankings. Note: *at least one group has a denominator <100 women (see Tables S1‐S18).
