Figure 3.

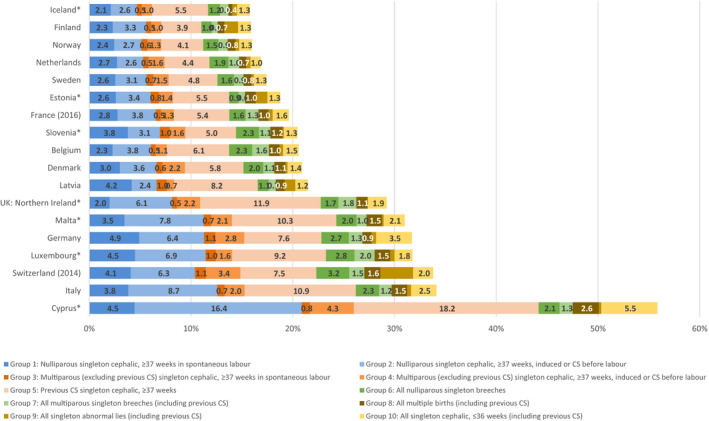
Contribution of the ten groups to the overall caesarean section (CS) rate by country ranked by overall caesarean section rate in 2015. Note: *at least one group has a denominator <100 women (see Tables S1‐S18).

Contribution of the ten groups to the overall caesarean section (CS) rate by country ranked by overall caesarean section rate in 2015. Note: *at least one group has a denominator <100 women (see Tables S1‐S18).