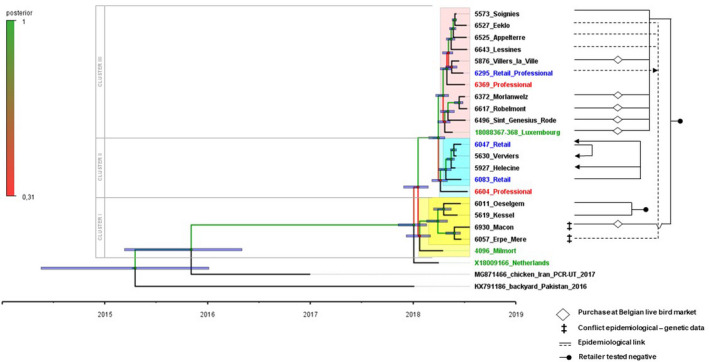
Figure 3.

Left side: Time‐resolved Bayesian phylogenetic analysis of the complete genomes of the 22 cases from the AOAV‐1 VII.2 BeNeLux‐outbreak, demonstrating 3 clusters. Both the age of the ‘tips’ (= sampling dates) and the predicted age of the nodes (with a purple node bare representing a 95% credibility interval from the MCMC model) can be read using the time scale below. Exact values of supporting posterior probability and divergence dates + their 95% HDP intervals are available in Table S2. Branches and nodes are colour coded according to their posterior probability support as indicated on the vertical scale. Certain taxon names are colour coded (unrelated to the posterior probability scale): Blue: cases from retailers; Red: cases from professional poultry holdings; Green: index cases in each affected country. Clusters are highlighted, where a lighter shade indicates taxa that are linked to a cluster with low posterior probability: Cluster I: yellow; Cluster II: blue; Cluster III: pink. Right side: Line diagram depicting the potential links between outbreaks (and connected retailers) identified in the epidemiological tracing investigations. Mismatches between genetic and epidemiologic data are identified with a ‡ symbol
