
Fig. 1.
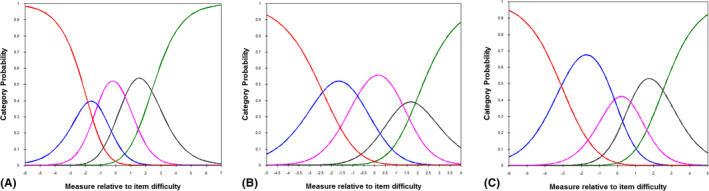
Category probability curves. The x‐axis of the category probability curve reflects the personal latent characteristic and the logit difference of item difficulty, while the y‐axis reflects the probability of the category being chosen. (A) Category probability curves for the questions with difficulty‐related response options in the National Eye Institute Visual Functioning Questionnaire‐25 (NEI VFQ‐25). The category probability curve was intersecting and ordered. The curve at the extreme left represents ‘stopped doing this because of eyesight’, while the curve at the extreme right represents ‘no difficulty at all’. The response option ‘stopped doing this for other reasons or not interested in doing this’ was treated as missing data and not included in the analysis. (B) Category probability curves for questions with frequency‐related response options in the NEI VFQ‐25, illustrating ordered thresholds. The five curves from left to right represent response categories ranging from ‘all of the time’ to ‘none of the time’. (C) Category probability curves for questions with agreement‐related response options in the NEI VFQ‐25, illustrating ordered thresholds. The five curves from left to right represent response categories ranging from ‘definitely true’ to ‘definitely false’. (D) Category probability curves for the Visual Function Index. Each response option was appropriately used, and category calibration increased in an ordered fashion. The curve at the extreme left represents ‘unable to do’, while the curve at the extreme right represents ‘no difficulty’. The response option ‘not applicable’ was treated as missing data.