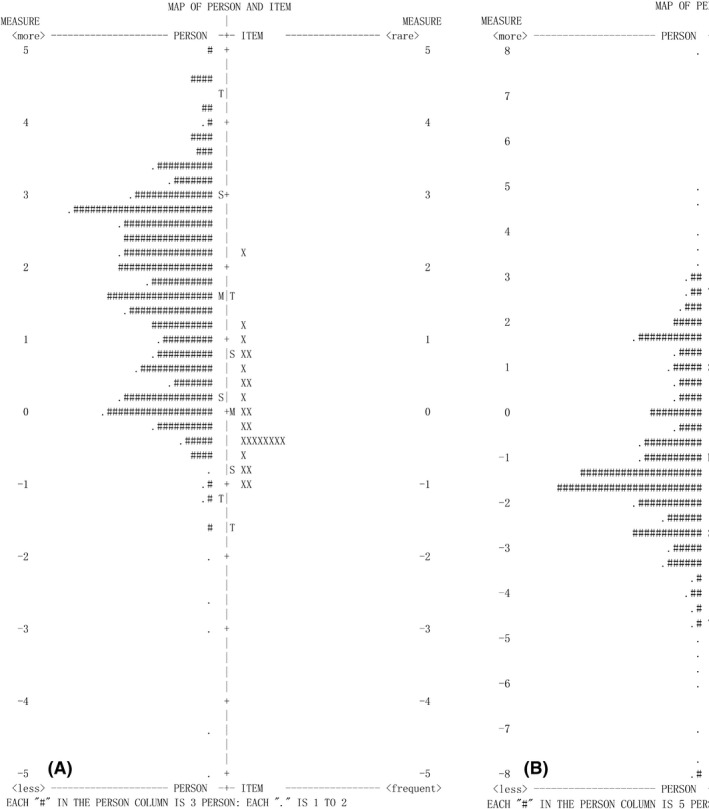
Fig. 2.

Person–item maps for the National Eye Institute Visual Functioning Questionnaire‐25 (NEI VFQ‐25) (A) and Visual Function Index (B). In each person–item map, participants are displayed to the left of the dashed line, with more able participants located at the top of the map. Items are located to the right of the dashed line, with more difficult items located at the top of the map. The vertical line represents the measure of the variable in linear logit units. ‘M’ markers represent the location of the mean measure. ‘S’ markers are placed one sample standard deviation away from the mean. ‘T’ markers are placed two sample standard deviations away.
