
FIGURE 1.
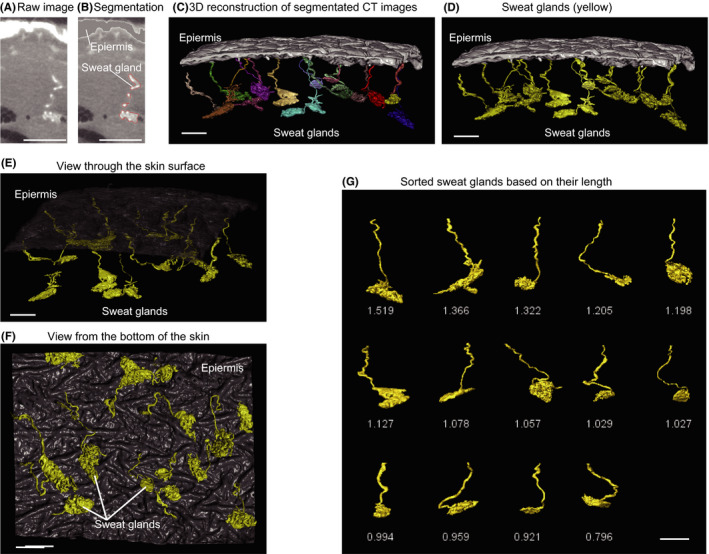
3D reconstruction of sweat glands and application of the methodology. A 4 mm3 skin specimen was observed by X‐ray micro‐CT. A, A raw CT image of a sweat gland. B, Segmented sweat gland on the same image. C, 3D reconstruction from segmented images, showing sweat glands. D, Sweat glands are colored yellow for clarity. E, Top view and (D) bottom view of sweat glands. G, Isolated sweat glands, ordered based on their length. These images were obtained from an abdominal skin specimen from a young (age 36) female subject. Scale bars indicate 500 µm