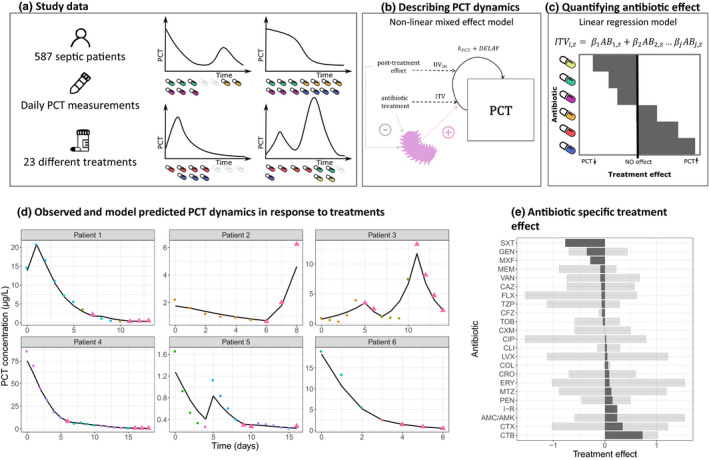
Figure 4.

Procalcitonin (PCT) biomarker case study workflow. (a) Overview of study data and examples of biomarker time course data in relation to antibiotic therapy. (b) Pharmacodynamic model to capture PCT dynamics and antibiotic drug effects, where kpct represents a first‐order infection induced production or degradation rate of PCT, delay a time‐dependent delay of antibiotic effect, interindividual variation (IIV)IM post‐treatment immune response, and intertreatment variation (ITV). (c) Quantification of individual antibiotic effects using a linear regression analysis. (d) A selection of observed PCT profiles (points) and model predictions (solid lines), illustrating the diversity of dynamics and treatments. Colored points indicate different treatments, consisting up to three antibiotics, whereas triangles indicate observation without any treatment. (e) The mean (dark gray area) and the range (shaded area) of the treatment response related to pairwise combinations and mono‐treatments per individual antibiotic. A negative treatment response value is associated with decrease of PCT while a positive is associated with an increase.
