FIGURE 4.

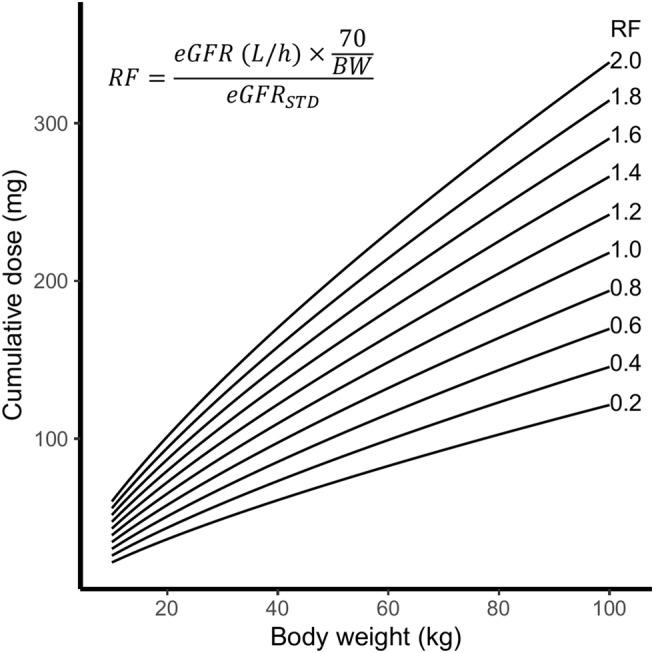
Line plot of the 4‐day cumulative clofarabine dose as a function of the body weight (kg) for several relative renal function values (RF)

Line plot of the 4‐day cumulative clofarabine dose as a function of the body weight (kg) for several relative renal function values (RF)