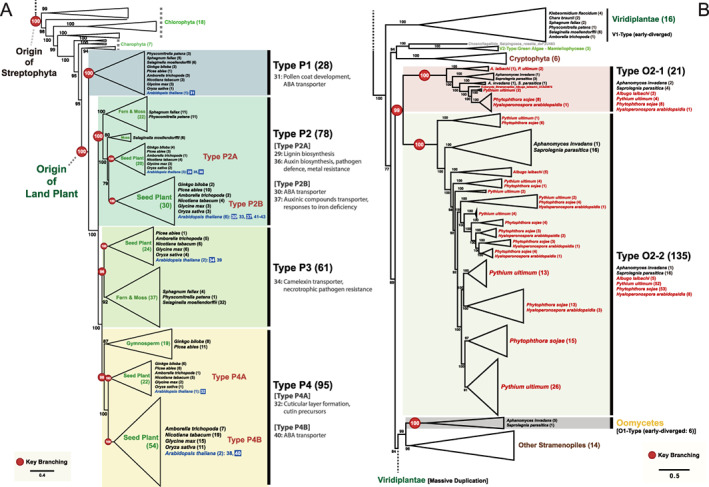
FIGURE 2.

Phylogeny of the full‐size ABCGs representing the major duplication events in land plants and oomycetes. (A) A subtree of full‐size ABCGs of Chlorophyta and land plants. The AtABCG transporters, which were identified in previous studies (listed in Table S1), are on a blue background and their functions are summarized in the figure. (B) A subtree of full‐size ABCGs of Stramenopiles rooted with Viridiplantae. The plant pathogenic oomycetes are indicated with red letters. The subtrees in (A) and (B) are derived from the full tree presented in Fig. S1. The number next to the name of the species indicates the number of ABCGs. Branch support is shown as the ultrafast bootstrap support value and the red circles represent key branching points. Some clades were merged to improve readability. The scale bar indicates the branch length measured in the number of amino acid substitutions per site.
