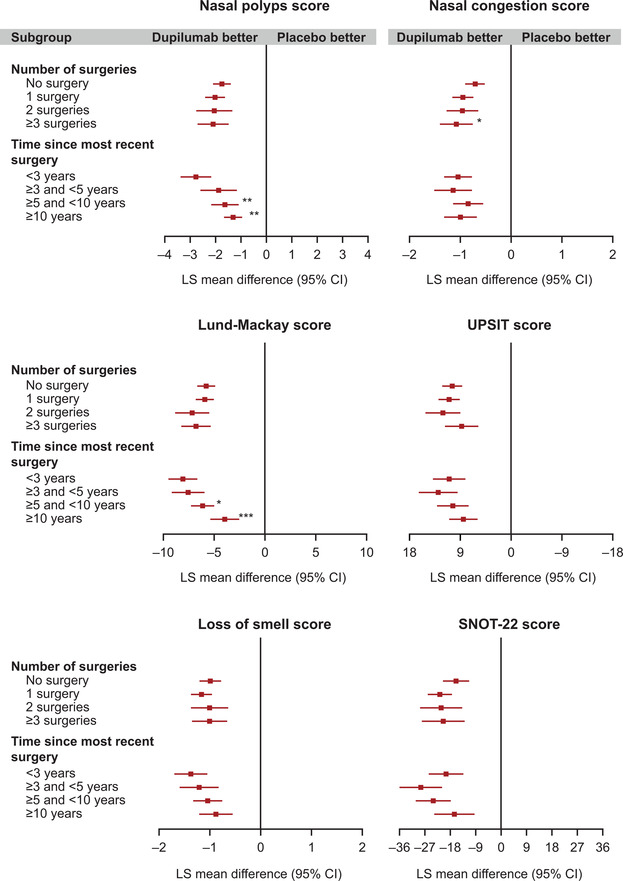
FIGURE 1.

Dupilumab efficacy outcomes at week 24 by number of prior sinus surgeries, and by time since last sinus surgery. All panels show the LS mean difference in change from baseline, comparing the dupilumab vs placebo. *Subgroup‐by‐treatment interaction p < 0.05; ** p < 0.01; *** p < 0.001. LS mean: imputed complete data were analyzed by fitting an ANCOVA model with the corresponding baseline value, treatment group, asthma/NSAID‐ERD status, regions, and the study as covariates. Analysis was based on the same imputed dataset using WOCF/MI from primary analysis of the co‐primary endpoints. Interaction p value computed by fitting an ANCOVA model with the corresponding baseline value, treatment group, asthma/NSAID‐ERD status, and regions as covariates, plus the subgroup variable and the subgroup‐by‐treatment interaction and the study. The “no surgery” and <3 years subgroups were considered as references for the calculation of the interaction p values for the number of surgery and the time since most recent surgery subgroup analyses, respectively. ANCOVA = analysis of covariance; CI = confidence interval; LS mean = least squares mean; NSAID‐ERD = nonsteroidal anti‐inflammatory drug‐exacerbated respiratory tract disease; SNOT‐22 = 22‐item Sino‐Nasal Outcome Test; SE = standard error; UPSIT = University of Pennsylvania Smell Identification Test; WOCF/MI = worst observation carried forward/multiple imputation.
