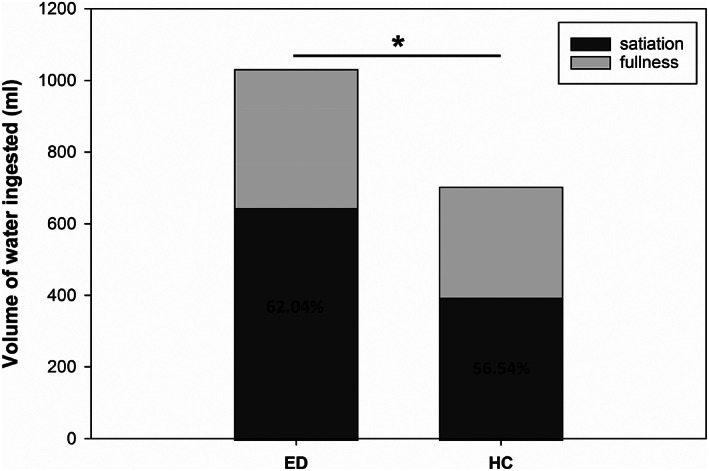
FIGURE 1.

Mean volumes of water ingested until satiation and until maximum fullness in eating disordered individuals and in healthy controls. Percentages indicate mean percentages of satiation to total amount of water consumed. *p < .01, total water volumes ingested, eating disordered patients (ED) versus healthy controls (HC)
