
FIGURE 2.
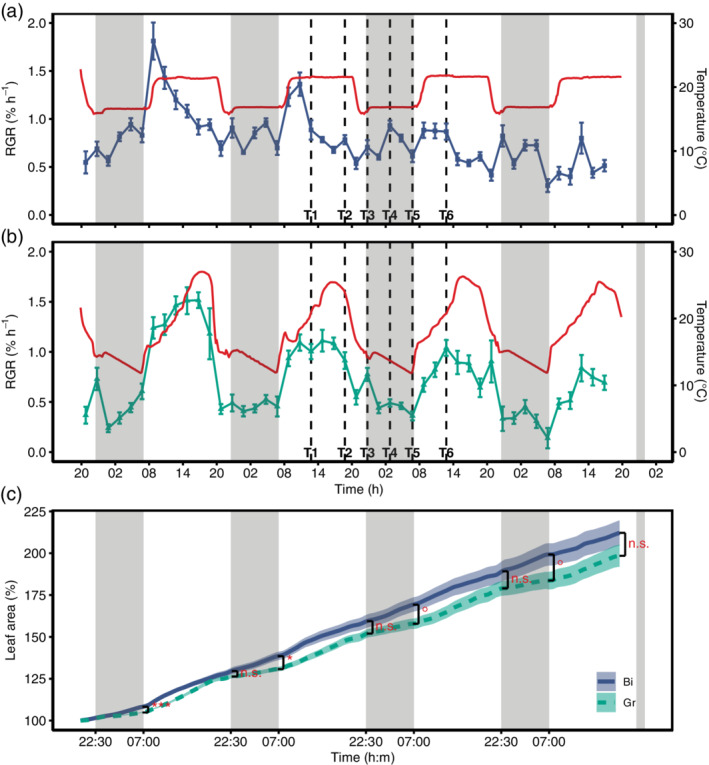
Diurnal growth pattern of soybean leaves under controlled conditions in growth cabinets exposed to contrasting temperature regimes. (a) The relative growth rate (RGR; %hr−1) under binary diurnal temperature conditions (Bi, blue squares) and (b) the RGR under gradual temperature conditions (Gr, green triangles) in relation to temperature (solid red lines). RGR data were aggregated to 2 hr (Mean ± SE, n = 9 replicates per treatment). The vertical black dashed lines indicate the sampling time points (T1–T6) for RNA sequencing and carbohydrate analysis. (c) The mean ± SE of measured leaf area in % of initial leaf area for the respective treatments (Bi, blue solid line; Gr, green dashed line). Black brackets and the corresponding significance indicators (***p < .001; *p < .05; °p < .1; n.s., not significant) indicate differences in leaf area after the respective light and dark periods (visualized by the shaded grey areas) between the treatments [Colour figure can be viewed at wileyonlinelibrary.com]