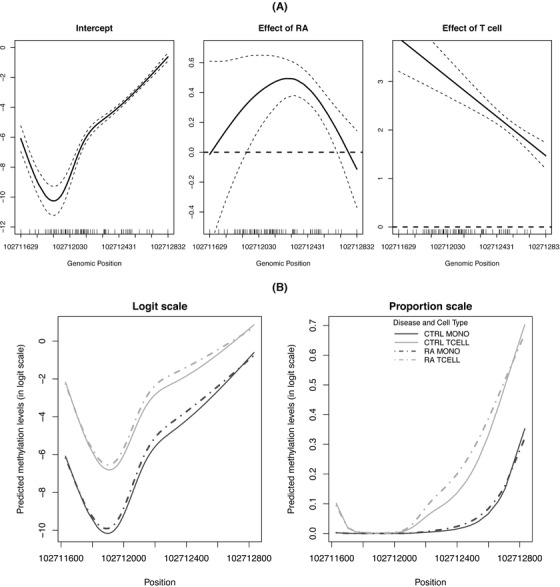
FIGURE 1.

(A), The estimates (solid lines) and 95% pointwise confidence intervals (dashed lines) of the intercept, the smooth effect of RA and cell type (T cells versus monocytes) on methylation levels. (B), The predicted methylation levels in the logit scale (left) and proportion scale (right) for the four groups of samples with different disease and cell type status. The region‐based P‐values for the effect of RA status and T cell type are calculated as and , respectively
