FIGURE 3.

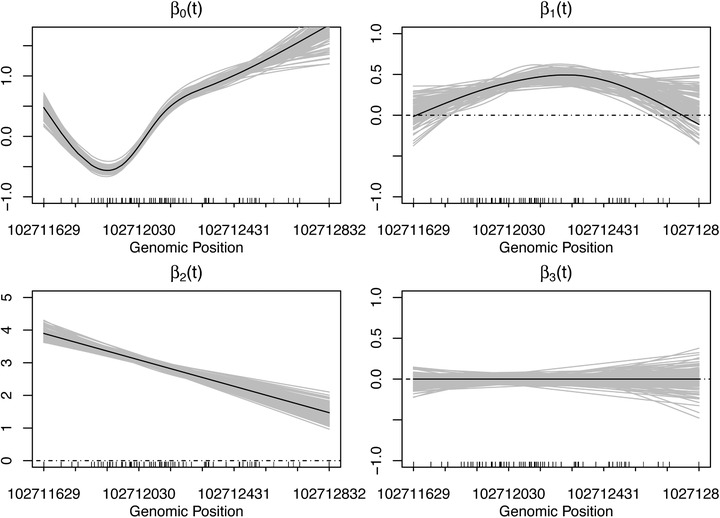
Estimates of smooth covariate effects (gray) over the 100 simulations in Scenario 1, using SOMNiBUS. The black curves are the true functional parameters used to generate the data. Data with sample size were generated with error

Estimates of smooth covariate effects (gray) over the 100 simulations in Scenario 1, using SOMNiBUS. The black curves are the true functional parameters used to generate the data. Data with sample size were generated with error