FIGURE 6.

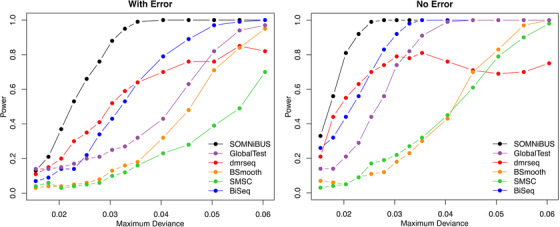
Powers to detect DMRs using the six methods for the 14 simulation settings in Scenario 2 under different levels of maximum deviation between and , calculated over 100 simulations. (Sample size ).

Powers to detect DMRs using the six methods for the 14 simulation settings in Scenario 2 under different levels of maximum deviation between and , calculated over 100 simulations. (Sample size ).