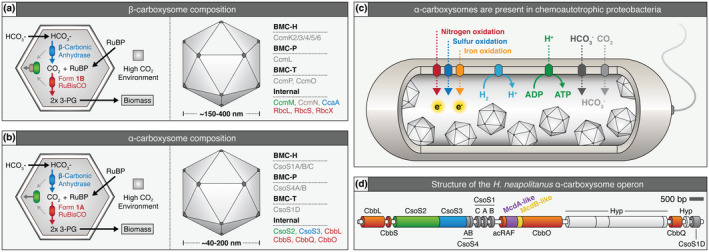
FIGURE 1.

Overview of α‐ and β‐carboxysome composition, operon structure, and prevalence in proteobacteria. (a) Cartoon illustration of internal reactions (left) and known components (right) of β‐carboxysomes and (b) α‐carboxysomes. (c) α‐carboxysome‐containing proteobacteria display diverse metabolic capacities. (d) H. neapolitanus α‐carboxysome operon. Red = Rubisco or Rubisco associated, green = CsoS2 which mediates Rubisco/shell interaction, blue = carbonic anhydrase, purple = putative mcdA gene, yellow = putative mcdB gene, dark grey = shell component, light grey = hypothetical protein (Hyp). Gene colors are matched to the proteins shown in panel B and functionally equivalent proteins for β‐carboxysomes in panel A [Colour figure can be viewed at wileyonlinelibrary.com]
