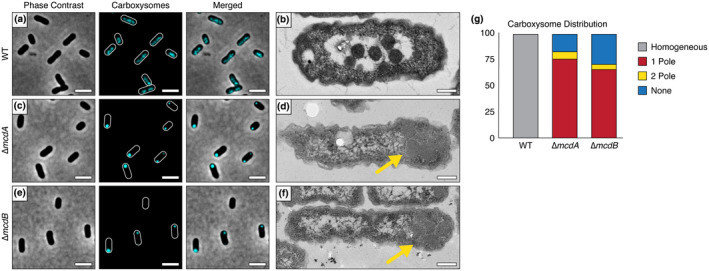
FIGURE 2.

An McdAB system positions α‐carboxysomes. (a) The carboxysome reporter CbbS‐mTQ is distributed in WT H. neapolitanus cells. Scale bar: 2 µm. (b) Electron micrograph showing α‐carboxysomes confined to the nucleoid in WT cells. Scale bar: 200 nm. (c) Homogenous distribution of α‐carboxysomes is lost in the absence of McdA. Scale bar: 2 µm. (d) Polar localization of assembled α‐carboxysomes in the absence of McdA (yellow arrow). Scale bar: 200 nm. (e) Homogenous distribution of α‐carboxysomes is lost in the absence of McdB. Scale bar: 2 µm. (f) Polar localization of assembled α‐carboxysomes in the absence of McdB (yellow arrow). Scale bar: 200 nm. (g) Quantification of carboxysome distributions. In ∆mcdA (n = 210 cells), 76% of cells had a single polar focus, 7% displayed two foci at opposing poles, and 17% lacked a focus. In ∆mcdB (n = 220 cells), 66% of cells had a single polar focus, 5% displayed two foci at opposing poles, and 29% lacked a focus [Colour figure can be viewed at wileyonlinelibrary.com]
