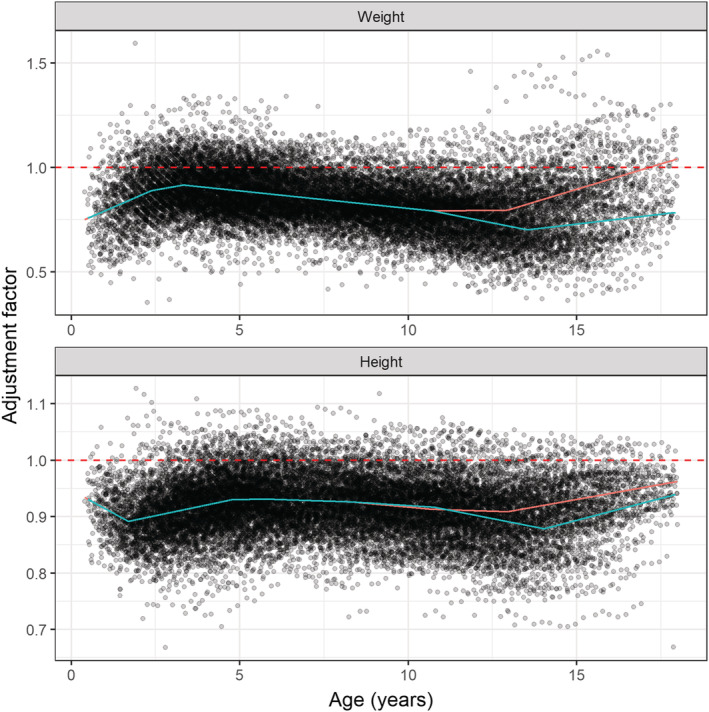
FIGURE 3.

Adjustment factors for patient weight (top) and height (bottom). The lines represent the piecewise linear functions describing the relation between age and the adjustment factor for females (red) and males (blue). The functions are given in Supporting Information Tables S1 and S2. The dashed red line represents the situation where a population is already in line with WHO and CDC growth charts
