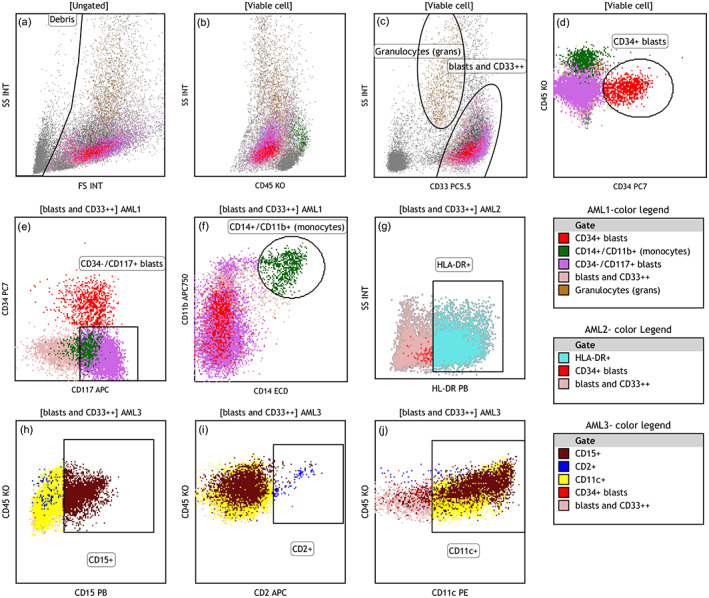
FIGURE 1.

Clustering and color‐coding strategy for Radar Plot analysis exemplified using a case of blastic NPM1+ AML: (a) debris and erythrocyte aggregates were excluded. (b) “viable cell” gate on SSC/CD45 plot with CD34+ blasts shown as red dots (see d) and monocytes as green dots (see f) (c) granulocytes were separated by intermediate CD33 expression and high SSC (brown dots); other CD33+ myeloid cells were gated as “blasts and CD33++” and painte pale pink. Later the pink color was superseded by other distinctive markers in different colors. (d) CD34+ cell cluster (red dots) in AML1 panel (e) CD34−/CD117+ cell cluster (bright pink) in AML1 panel. (f) CD11b+/CD14+ monocytes were painted as green dots in AML1 panel, dim CD117 (bright pink) is seen on a fraction of monocytes (g) HLA‐DR positive leukemic cells (cyan dots) seen in AML2 panel. (h–j) expression of CD15 and CD11c is seen on leukemic cells (maroon and yellow dots, respectively) while CD2 was negative (dark blue dots). Color legends are arranged based on descending color precedence in each panel with intent to highligh distinctive markers [Color figure can be viewed at wileyonlinelibrary.com]
