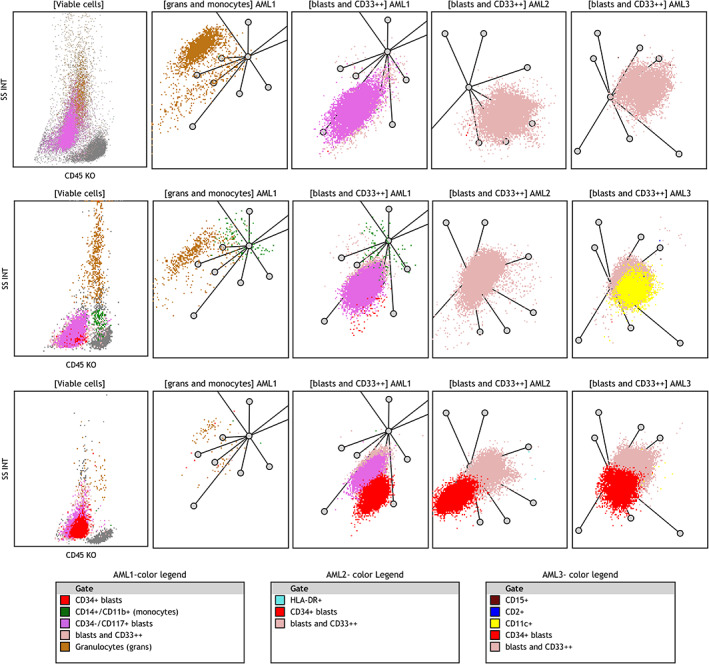
FIGURE 6.

Examples of rare cases where differentiation between vAPL and NPM‐1+ AML was more difficult on RPs. Upper row illustrates a case of variant APL and middle and lower rows show two cases of blastic NPM1+ AML. These three cases show similar features with minor differences and did not show all distinctive features associated with each entity. The APL‐variant case in the upper row shows intermediate SSC on SSC/CD45 plot and lack of monocytes as APL‐related features. The NPM1+ AML case in the middle row shows low SSC and expression of CD11c on leukemic cells (yellow dots in AML3 ‐RP) as a characteristic feature. The NPM1+ AML case in the lower row shows low SSC and a partial expression of CD34 on leukemic cells (the red cluster). Axes of RPs are arranged as shown in Figure 2. Color legends are arranged based on descending color precedence in each panel with intent to highlight distinctive markers. AML, acute myeloid leukemia; APL, acute promyelocytic leukemia; RP, radar plot [Color figure can be viewed at wileyonlinelibrary.com]
