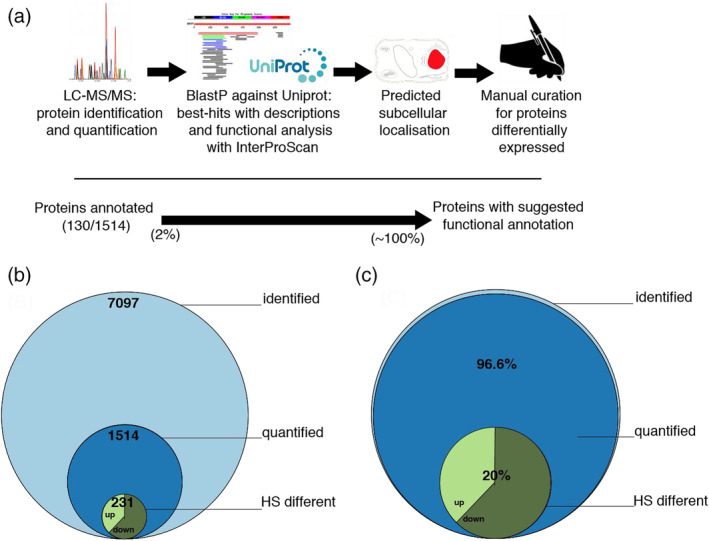
FIGURE 1.

Workflow for the identification and annotation of Physcomitrium patens proteins. Illustration of the pipeline to produce the annotations used in this study (a). Stacked Venn diagram showing the number of different proteins identified, significantly quantified and significantly differentially accumulated proteins in physcomitrium patens under heat‐priming (b) and in mass fraction of the significantly quantified (c) [Colour figure can be viewed at wileyonlinelibrary.com]
