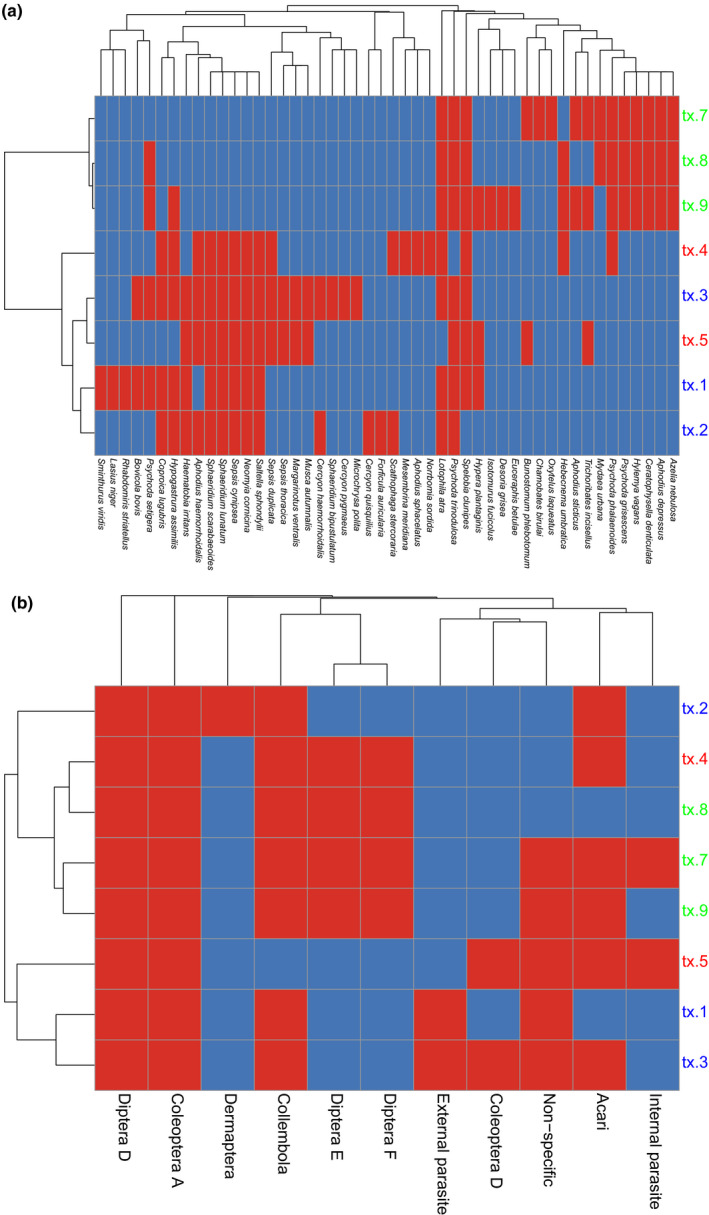
FIGURE 4.

Cluster analyses and heat map at the level of (a) species and (b) trophic group (based on Skidmore, 1991), showing presence (red) and absence (blue) of each species or trophic group found in the dung samples from dry grassland (tx.1–tx.3), meadow (tx.4–tx.5), and forest (tx.7–tx.9)
