FIGURE 1.

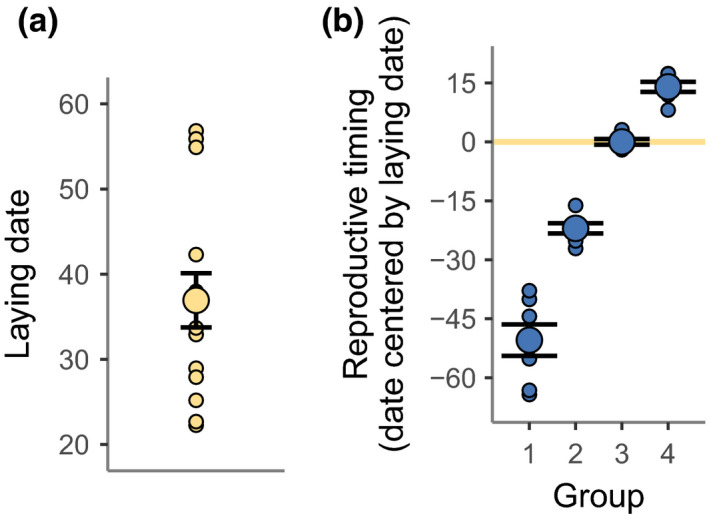
Reproductive timing. (a) Mean laying date with standard errors (in April dates, i.e., 1 = April 1) with the laying date of individual females (n = 14) in the background. (b) The reproductive timing (y‐axis) of the four reproductive timing groups (x‐axis): (1) early pre‐laying group, (2) late pre‐laying group, (3) laying group, (4) post‐laying group. Reproductive timing is calculated as the sampling date centred by females’ laying date (i.e., reproductive timingij = sampling dateij – laying datej for sampling time i and female j). Mean reproductive timing of each group with standard errors is shown and reproductive timing of the individual samples within each group are displayed in the background. Yellow line highlights the reproductive timing that corresponds to females’ laying date
