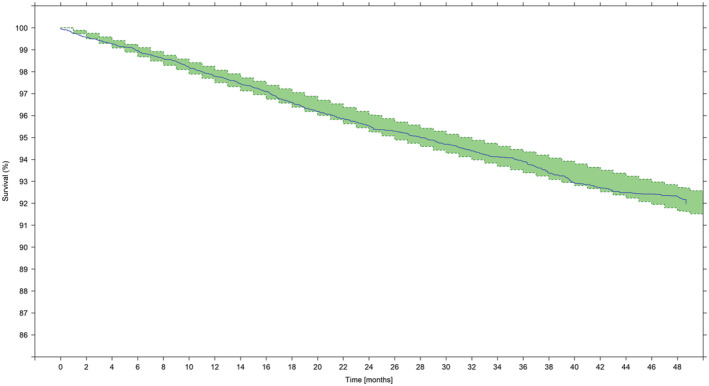
FIGURE 2.

Visual predictive check showing the Kaplan‐Meier survival estimate over time. Survival (y axis) indicates the proportion of patients who have not had an event; at time zero the survival is 100% (ie, no patient has experienced an AUR/S). The solid line describes the observed time to first AUR/S over the period of 48 months across the overall population, irrespective of treatment. Shaded areas show the model‐predicted 95% confidence intervals of the survival
