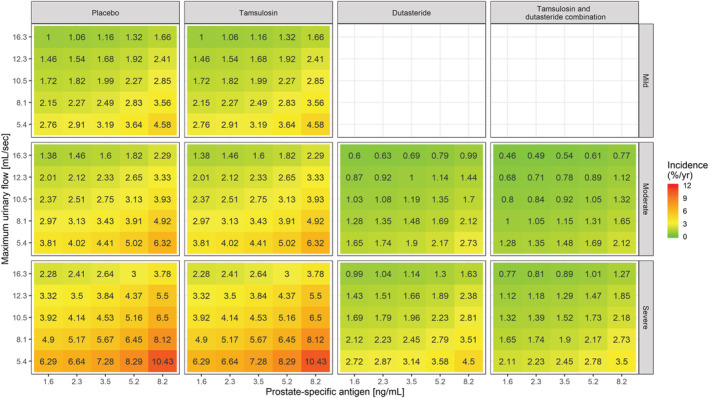
FIGURE 6.

Heat map showing the incidence of AUR/S per year vs prostate‐specific antigen and maximum urinary flow stratified by treatment and symptoms severity. The colour gradient from green to red reflects the increase in incidence of AUR/Sin patients with higher symptom scores, larger PSA and lower Q max values at baseline. Tamsulosin does not alter the underlying baseline hazard rate. Consequently, it does not modify the effect of baseline covariates on the incidence of events. This contrasts with dutasteride (both as monotherapy and combination therapy), which shows disease‐modifying properties. The midpoint for the colour gradient was set to 2.84%, which corresponds to the point estimate of the baseline hazard rate after placebo treatment. AUR/S incidence estimates were calculated taking into account the observed covariate distributions in Supporting Information Figure S1 and as such describe the effect of the different covariates in hypothetical LUTS/BPH patients across a clinically relevant range of values
