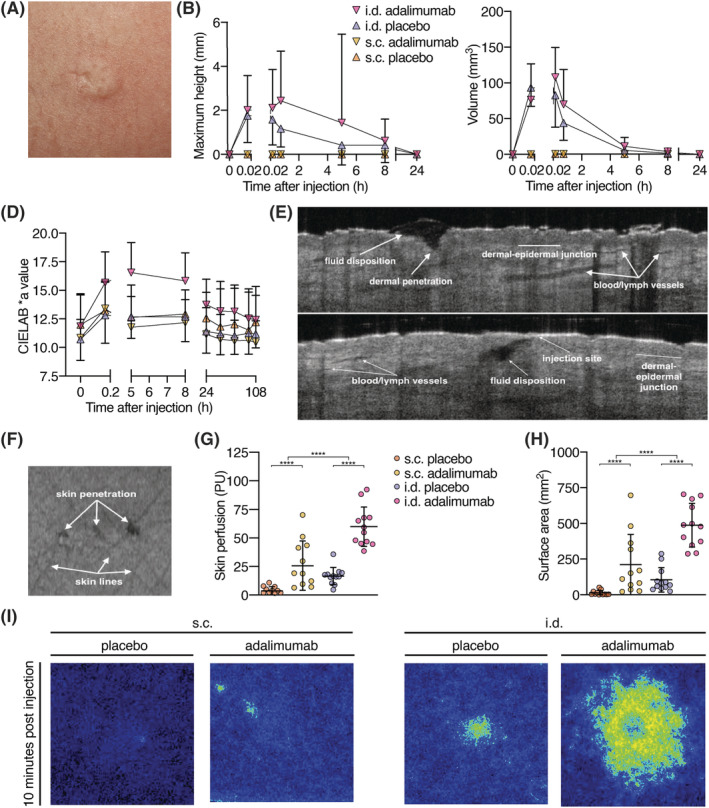
FIGURE 5.

Characterization of skin reaction following subcutaneous (s.c.) and intradermal (i.d.) injection. (A‐C) 3D photography. (A) Typical bleb after i.d. injection. (B) Maximum height and volume of injection site. Bleb height and volume did not differ between i.d. adalimumab and i.d. placebo (height P = .26, volume P = .29). (D) Redness of the injection sites: The more positive the CIELAB *a ratio, the redder the injection site. I.d. adalimumab and placebo injections induced significantly more redness of the skin compared to s.c. adalimumab and placebo injections (P < .0001). Skin redness induced by adalimumab injection was significantly higher for i.d. administration than for placebo injection (P = .0014; E, F) Representative OCT images of i.d. injection 10 minutes postinjection; (D, E) Cross‐sectional planes of i.d. injection, and (F) top view of skin surface with 3 puncture holes. (G) Skin perfusion in arbitrary PU 10 minutes postinjection, measured with LSCI. (H) Injection site surface area 10 minutes postinjection. A significant difference in skin perfusion and surface area 10 minutes postinjection was observed for both administration method (P < .0001) and treatment (P < .0001). (I) Representative LSCI images of both injection methods and treatments 10 minutes postinjection. LSCI: laser speckle contrast imaging; OCT: optical coherence tomography; PU: perfusion units; B, D, G, H: mean ± standard deviation, n = 12 per group, repeated measures ANOVA, **** P < .0001
