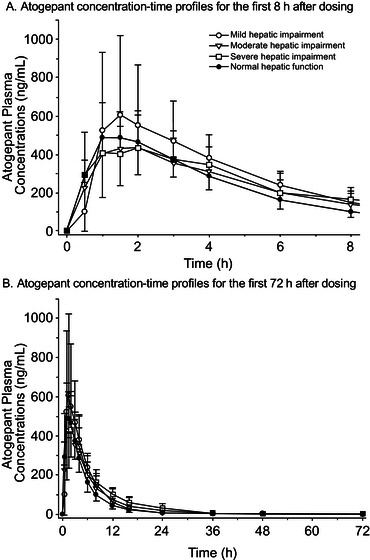
Figure 2.

Plasma atogepant mean concentration‐time profiles following a single 60‐mg dose. Atogepant concentrations are shown on a linear scale for (A) the first 8 hours after administration and (B) the entire study (72 hours after administration). Mean values are shown for participants with severe (open squares), moderate (open triangles), and mild (open circles) hepatic impairment and for participants with normal hepatic function (closed circles). Error bars represent standard deviations. SD, standard deviation.
