
FIGURE 1.
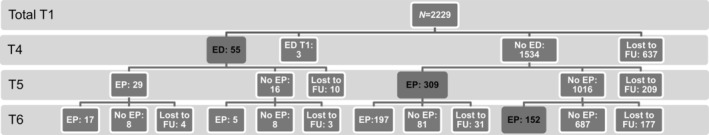
Flow chart eating pathology. Number of participants with eating pathology at each assessment wave. Mean ages: T1 11.1 years, T4 19.1 years, T5 22.3 years, T6 25.7 years. ED = lifetime eating disorder diagnosis; ED T1 = eating disorder diagnosis with an age of onset preceding or being equal to age at T1; EP = eating pathology according to the Eating Disorder Diagnostic Scale (EDDS), an EDDS cut‐off score of 16.5 was used to classify participants with eating pathology. FU = follow‐up. Black: incident eating pathology developed between T1 and T4, between T4 and T5 or between T5 and T6