
FIGURE 5.
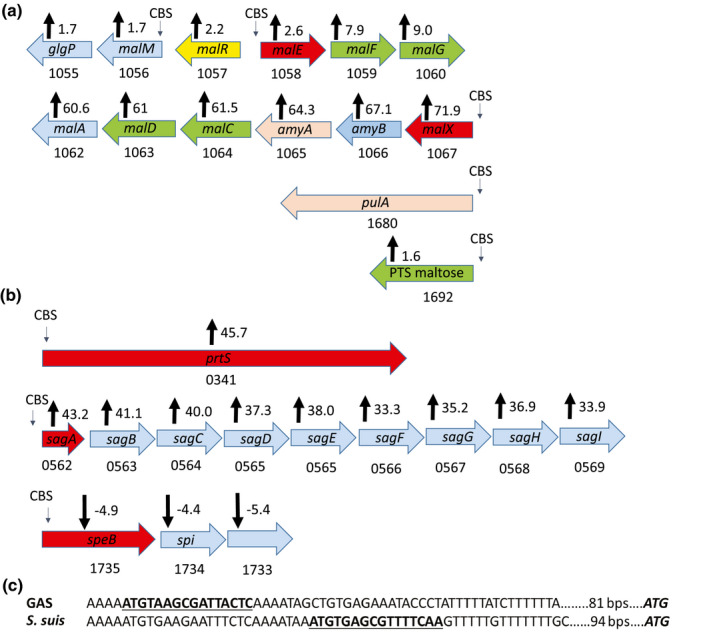
CcpA‐bound sites in MGAS2221. Schematic representation of the binding sites for CcpA (CBS) in key (a) carbohydrate transport and (b) virulence factor encoding genes. Fold change in transcript levels upon CcpA inactivation is displayed with black arrows. Positive numbers indicate higher transcript levels in 2221∆ccpA compared to MGAS2221. Genes in the schematic diagram are color coded to indicate function: blue—intracellular carbohydrate processing protein; yellow—transcriptional regulator; red—substrate binding lipoprotein; green—transport protein and beige—cell surface/secreted protein. (c) Sequence variation in the promoter region of the arginine deiminase (arcA) gene in GAS and S. suis. Enriched site for GAS and putative CcpA binding site for S. suis are highlighted