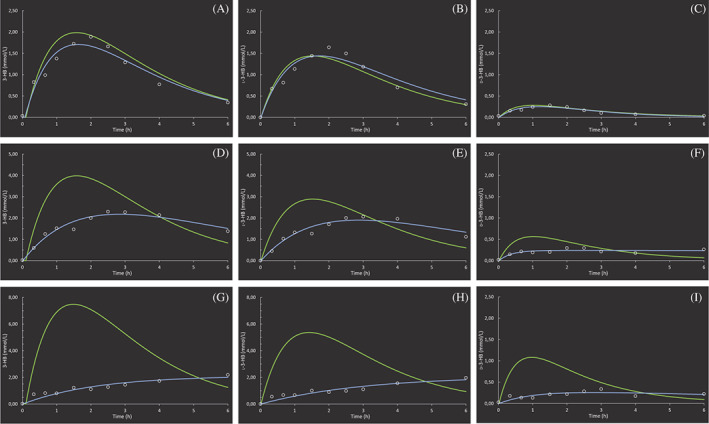
FIGURE 3.

The final, enantiomer‐specific population pharmacokinetic models after a single, oral dose of D,L‐3‐hydroxybutyrate in rats. The modeled blood‐concentration time plots of 3‐HB, D‐3‐HB, and L‐3‐HB after oral sodium D,L‐3‐HB at a salt‐free dose 1579 mg/kg (n = 6), A/B/C, 3159 mg/kg (n = 7), D/E/F, and 6317 mg/kg (n = 6), G/H/I. The green line represents the concentration‐time curve from the population model. The blue line depicts the individual a posteriori Bayesian‐estimated curve for one representative rat of the group, with the dots representing the measured concentrations
