
FIGURE 4.
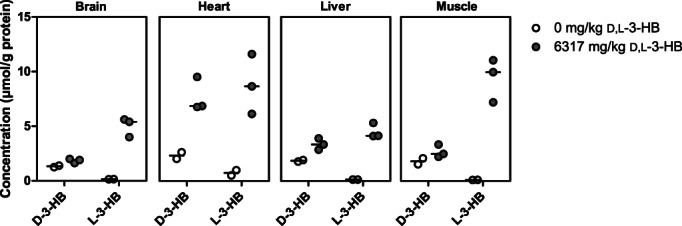
The enantiomer‐specific tissue distribution after a single, oral dose of D,L‐3‐hydroxybutyrate in rats. The concentrations of D‐3‐HB and L‐3‐HB in brain, heart, liver, and muscle of control animals (n = 2) and after oral sodium‐D,L‐3‐HB at a salt‐free dose of 6317 mg/kg (n = 3). Data are presented as scatter dot plots including median values