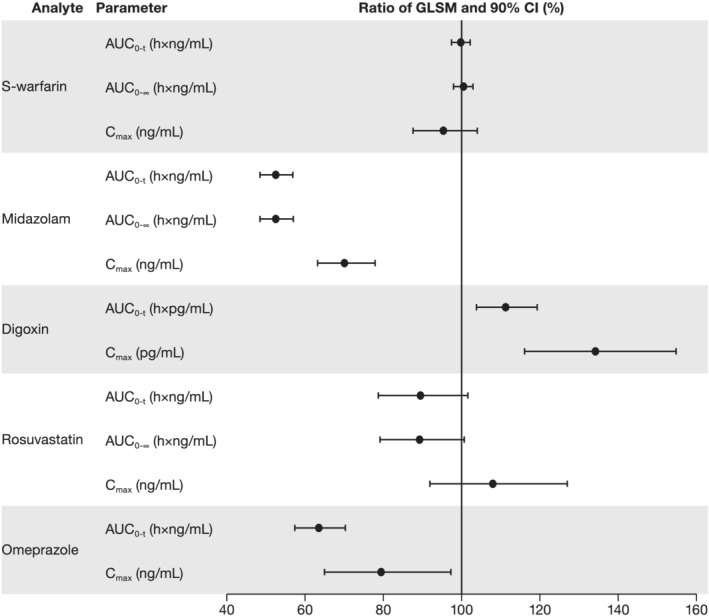
FIGURE 3.

Summary plot of the effect of zanubrutinib on the pharmacokinetic parameters of probe drugs. Abbreviations: AUC0‐∞ = area under the concentration–time curve from time zero to infinity; AUC0‐t = area under the concentration–time curve from time zero to the time of the last quantifiable concentration; CI = confidence interval; C max = maximum observed plasma concentration; GLSM = geometric least squares mean
