
Figure 1.
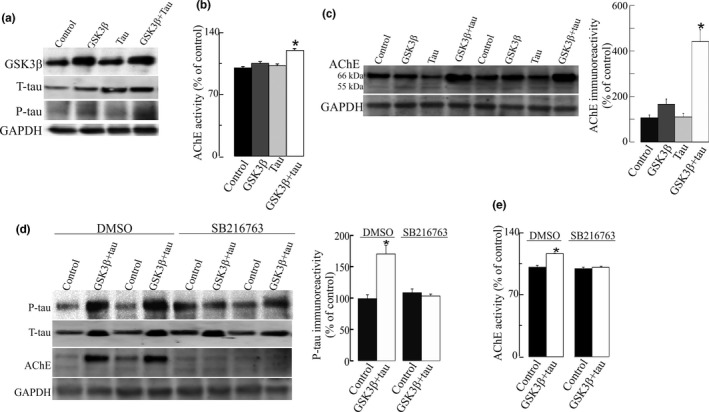
Increase in acetylcholinesterase (AChE) levels in neuroblastoma SH‐SY5Y cells with increased tau phosphorylation as a result of GSK3β and tau over‐expression. SH‐SY5Y cells were transfected with DNA vectors that encode GSK3β, wild‐type tau (tau), or both proteins (GSK3β + tau) or with a pCI empty control vector. (a) Each lane contained 30 µg of protein from cell extracts. Proteins were resolved by electrophoresis and probed with specific primary antibodies to GSK3β, tau or P‐tau (clone AT8). Representative blots are shown. Increased tau phosphorylation was observed in cells that over‐express GSK3β + tau. (b) AChE‐specific activity (mU/mg of total protein) was also determined in cellular extracts. Percentages (%) of AChE activity relative to pCI control cells are represented. (c) Fifty microgram protein extracts were then assayed by immunoblotting using the N‐19 antibody that recognizes all the AChE variants. Representative western blot (left panel) and densitometric quantification (right panel) expressed as percentage (%) relative to immunoreactivity of the control group are shown. Immunoreactivity values obtained by densitometry were normalized relative to that of the housekeeping protein GAPDH. (d) SH‐SY5Y cells transfected with a pCI empty vector or GSK3β + tau were treated with 20 μM of SB216763, a GSK3β inhibitor, or with vehicle (DMSO) for 24 hr. Inhibition of tau phosphorylation was quantified by a decrease in P‐tau immunoreactivity. AChE protein expression was also analyzed by western blots probed with N‐19 antibody. Representative blots are shown. (e) AChE enzymatic activity was assayed in cells treated with 20 μM of SB216763, and expressed as percentage (%) relative to control cells. Results were confirmed in n = 18 independent cell determinations (obtained from 3 independent cell sets of experiments). Represented values are means ± SEM. *Significantly different (p <.05) from the control group, as assessed by one‐way ANOVA followed by Tukey test for pair‐wise comparisons