Fig. 12.
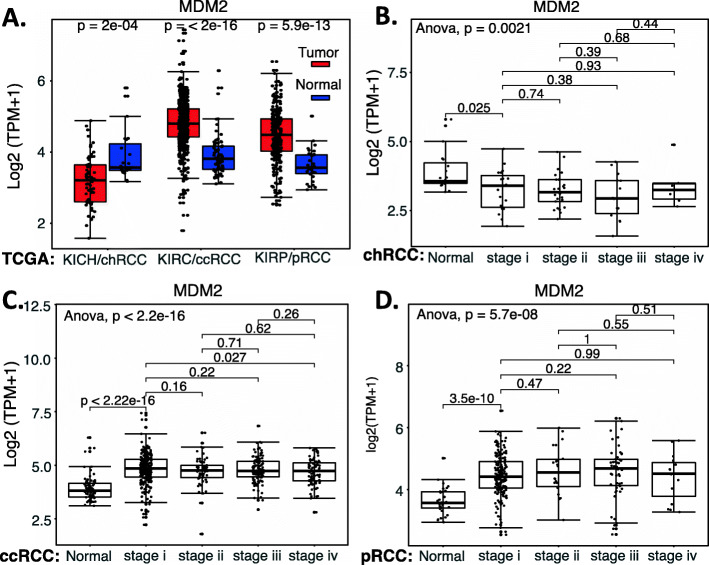
MDM2 expression in RCC tumor tissues versus in the associated normal tissue: Boxplots of the MDM2 expression level across TCGA-RCC subtypes in renal tumor (red) versus the associated normal renal tissues (blue) were presented (A). MDM2 expression among different stages of chRCC (B), ccRCC (C) and pRCC (D) versus the associated normal tissues was box-plotted. MDM2 expression was presented in the log2 (TPM + 1) scale format. Data were presented as the mean ± SD. A t-test was used to evaluate the statistical significance of the MDM2 mRNA expression level in normal renal tissues versus tumor tissues. One-way ANOVA was used to compare MDM2 expression among normal renal tissues versus different stages of RCC tumor tissues. The figure was performed using R version 4.0.3

