
Fig. 4.
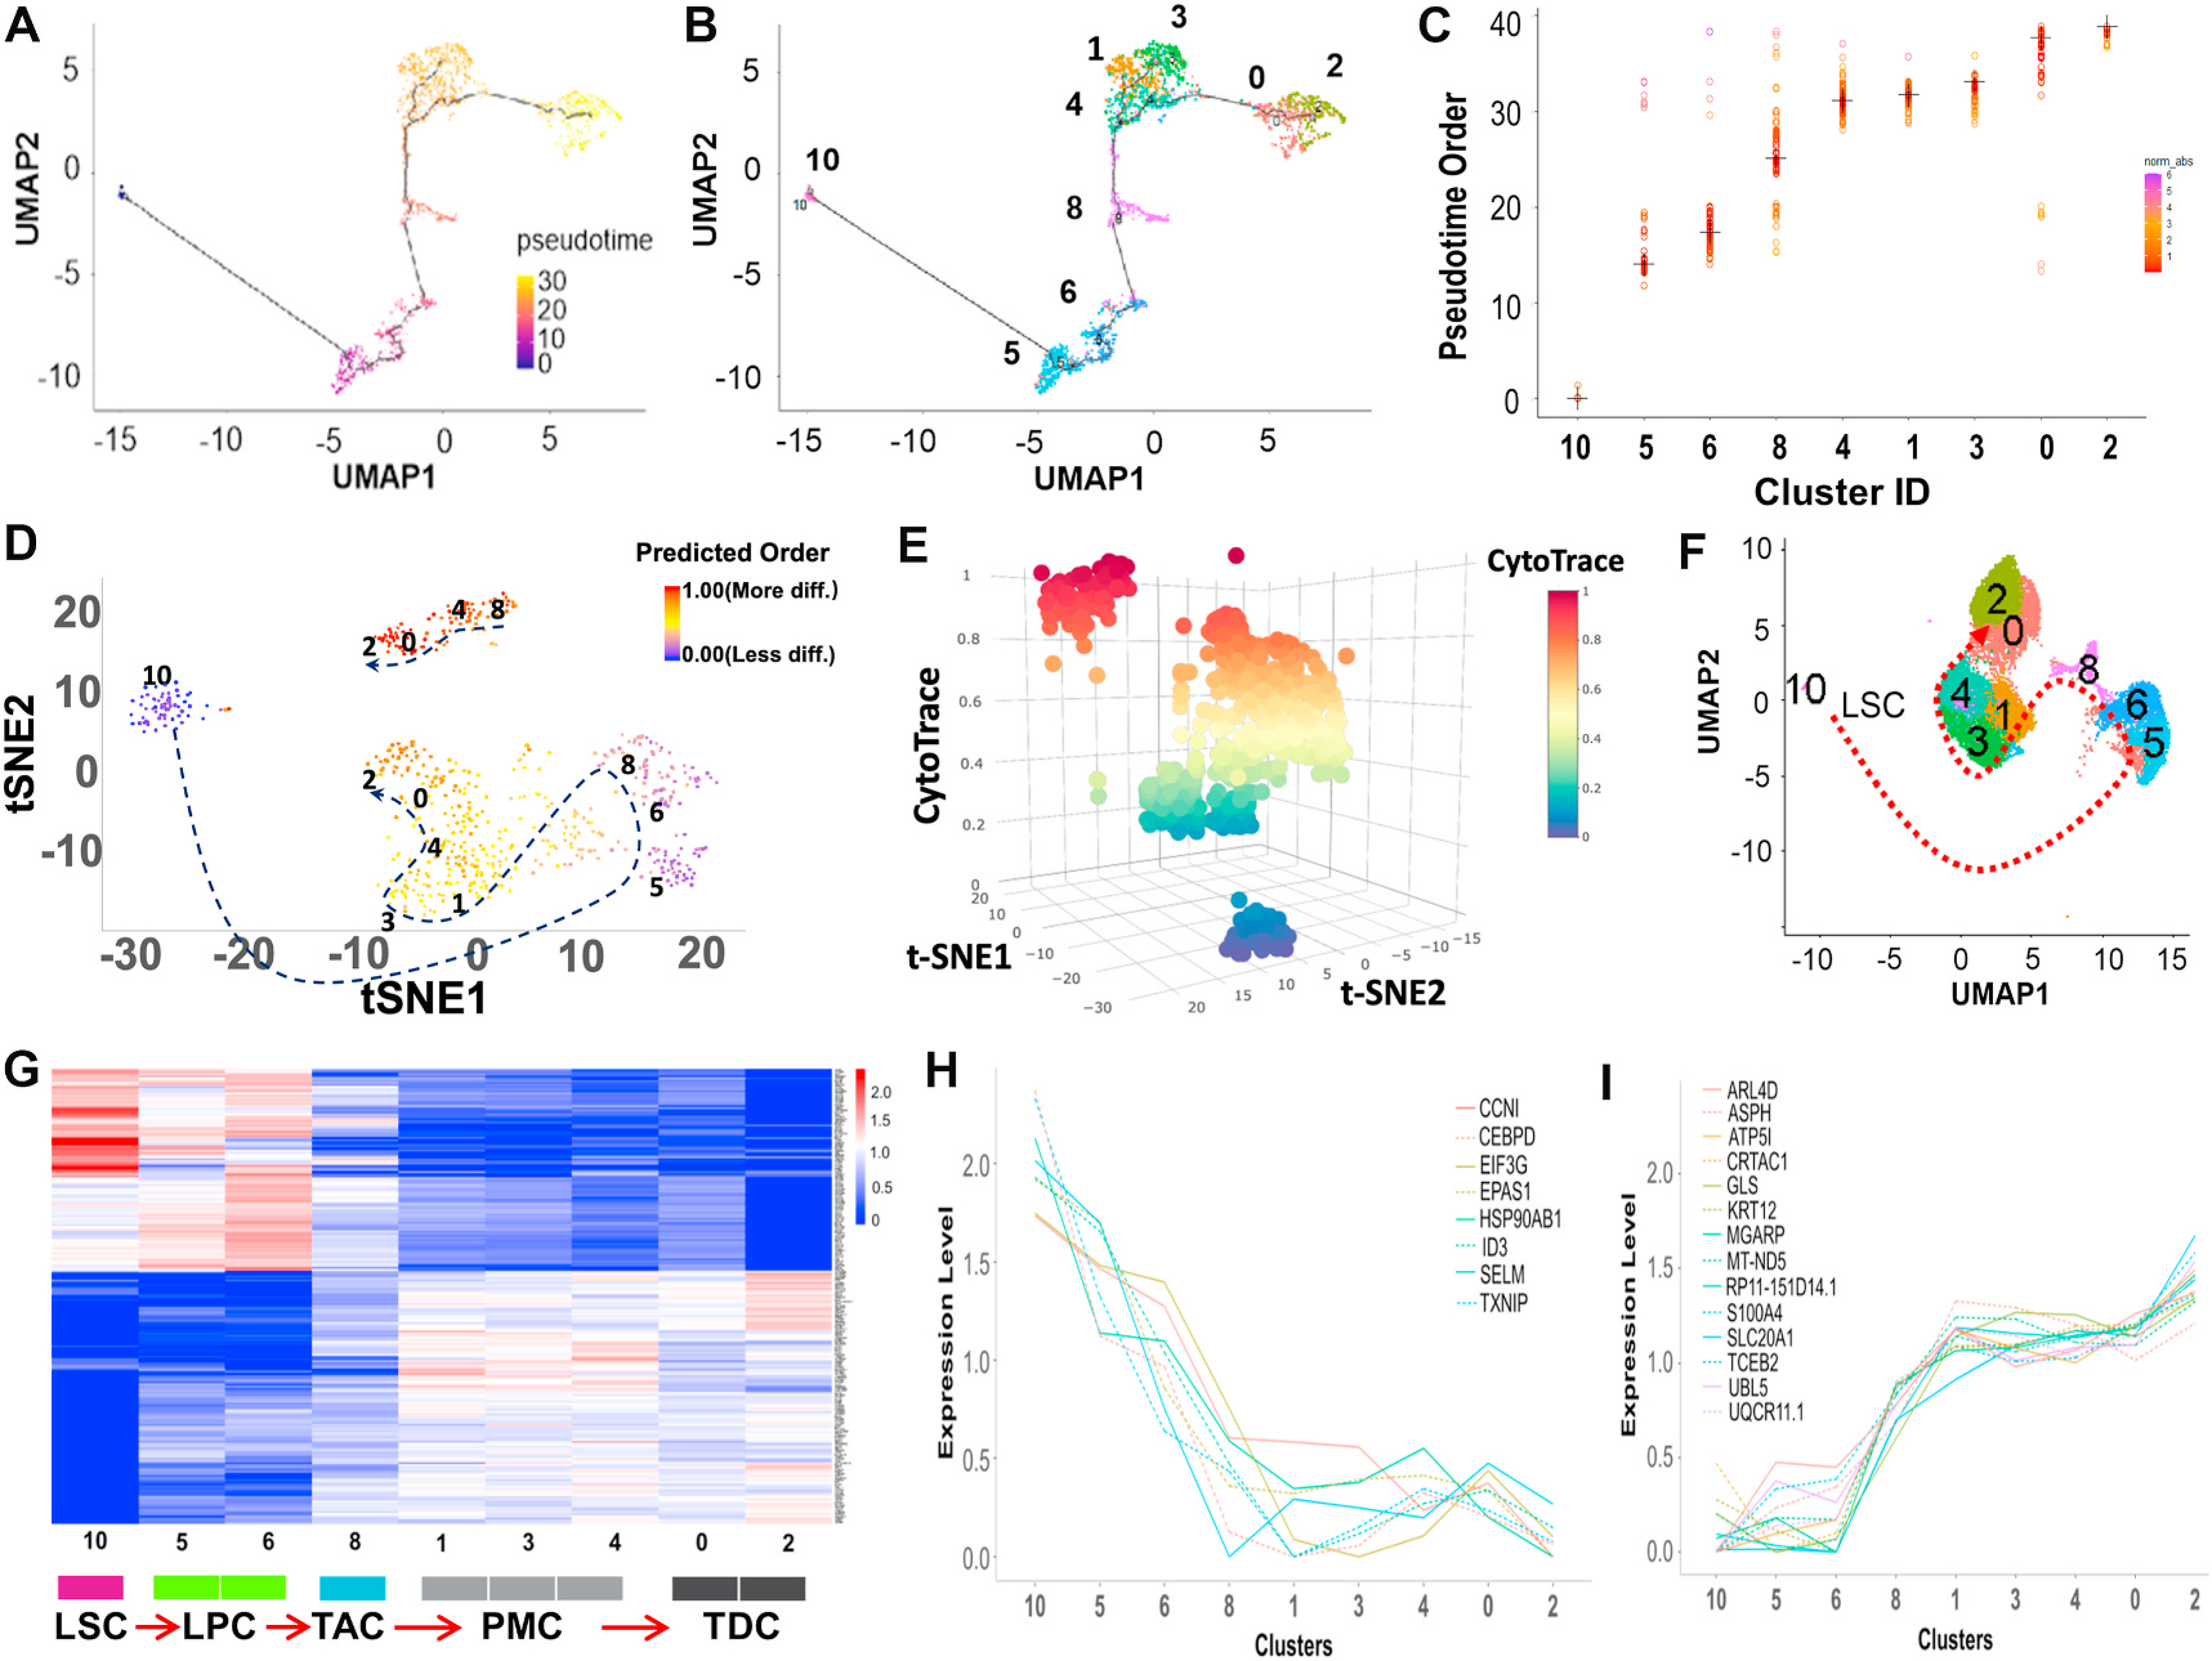
Reconstructing the developmental pseudotime trajectory of scRNA-seq data. A. The single-cell trajectory was predicted by Monocle 3 and visualized by UMAP. Cells are ordered in pseudotime colored in a gradient from purple to yellow. B. Monocle 3 generated pseudotemporal trajectory of 9 clusters identified in scRNA-seq clustering from Seurat analysis. Number and color represent each cluster. C. Plot of the pseudotime order for the 9 clusters from Monocle 3 analysis. Each dot represents a cell ordered in pseudotime grouped by clusters. Cluster median is marked as a cross. Distribution of pseudotime in each cluster is shown by the gradient color plotting each cell. D, E. CytoTRACE was used to predict the trajectory of the differentiation state of cells from nine clusters. Predicted differentiation state was visualized in 2D and 3D t-SNE plots based on the differentiation scores with the dotted arrow. F. Differentiation model on UMAP based on the trajectory analysis using Monocle 3 and CytoTRACE. The development and differentiation of the cells along the trajectory are in the order of clusters 10, 5, 6, 8, 1, 3, 4, 0, and 2, as shown in Fig. 4A–F. G. Heatmap of genes whose expression shows a significant trend along this trajectory using functional PCA in R. H, I. Different expression patterns of significant genes on differentiation status from LSC to TDC predicted by trajectory analysis.