Fig. 4.

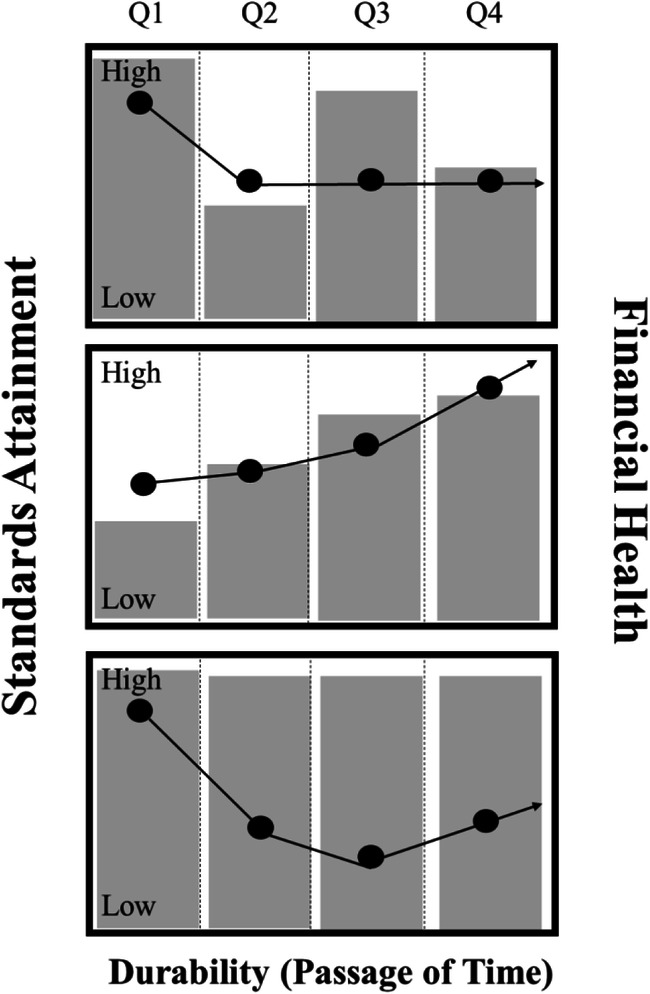
ASDQ Across Time. Note. This figure shows three hypothetical ASDQ scenarios (top, middle, and bottom). The line graph represents the primary axis and the bar graph represents the secondary axis.

ASDQ Across Time. Note. This figure shows three hypothetical ASDQ scenarios (top, middle, and bottom). The line graph represents the primary axis and the bar graph represents the secondary axis.