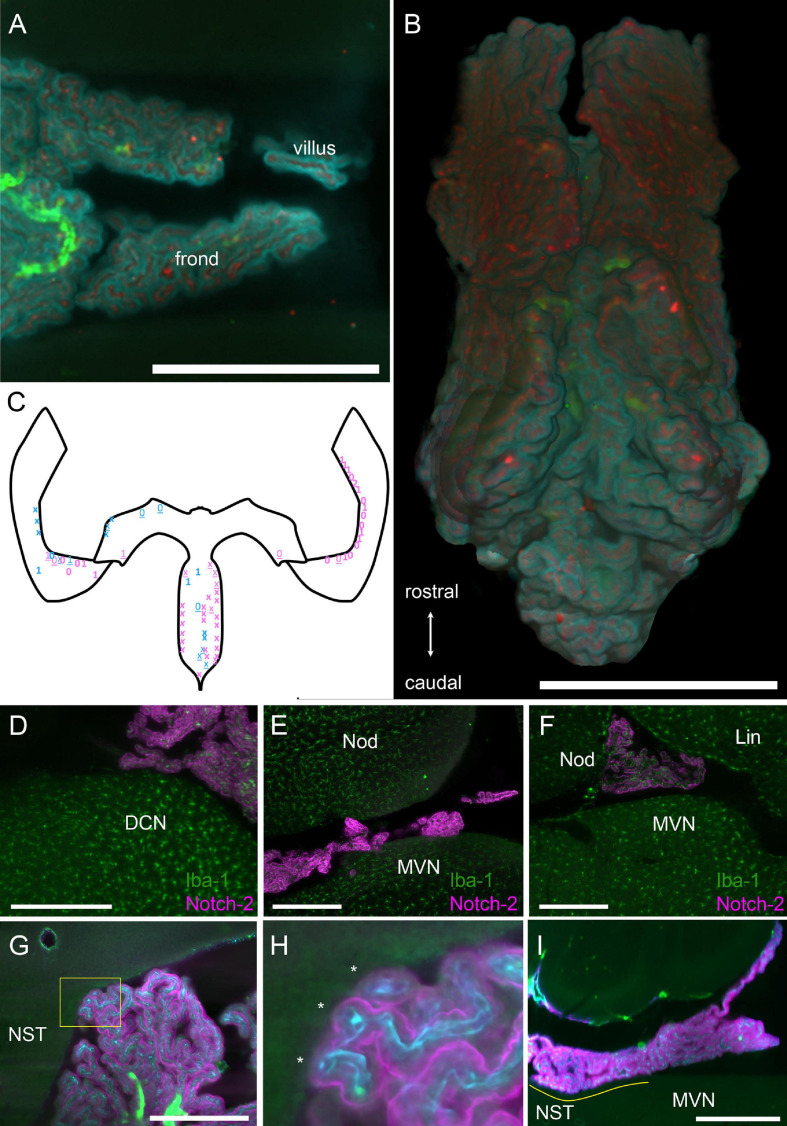
FIGURE 3.
Structure of hCP fronds and villi. (A) Example of frond and villus from the CSS. Z-stack maximal projection over 50 μm z-range (5 μm steps, 10 planes). Cyan, Notch-2; red, ColIV; green, autofluorescence and SMA. Scale bar: 1 mm. (B) Three-dimensional rendering of the ventral view of the whole SS segmented from the same sample in (A). Scale bar: 1 mm. (C) Schema of the CP as in Figure 1A, with indications of location and approximate size of contacts (each symbol indicates a single villus). Blue, males; pink, females. Numbers indicate macrophages at contact site for two animals. Xs indicate two different animals where macrophages were not labeled. Bold symbols indicate tight contacts, underlined symbols indicate loose contacts. In female samples, one was without bone, so only HS was considered, whereas the other was cut in half sagittally, so only HS was considered. In both male samples, right HS was damaged and was not considered. (D) Example of foot contacting the DCN. Z-stack maximal projection over 60 μm z-range (2 μm steps). Green, Iba-1 labeling; magenta, Notch-2. (E) Foot contacting the MVN. Z-stack maximal projection over 60 μm z-range (2 μm steps). Green, Iba-1 labeling; magenta, Notch-2. (F) Foot contacting the lingula. Single 2 μm optical slice. Green, Iba-1 labeling; magenta, Notch-2. Scale bar for (D–F): 400 μm. (G) Foot contacting the nucleus of the solitary tract. Single 3 μm optical slice. Green, autofluorescence and SMA; cyan, ColIV; magenta, Notch2 labeling. Scale bar: 500 μm. (H) Magnification of COLM image of the contact shown in G (yellow box). Three fronds (asterisks) each containing a capillary are seen contacting the ependyma. (I) Single sagittal 5 μm optical plane showing the extent of the largest observed contact area (yellow line). NST, nucleus of the solitary track. Scale bar: 1 mm.

