
Figure 1.
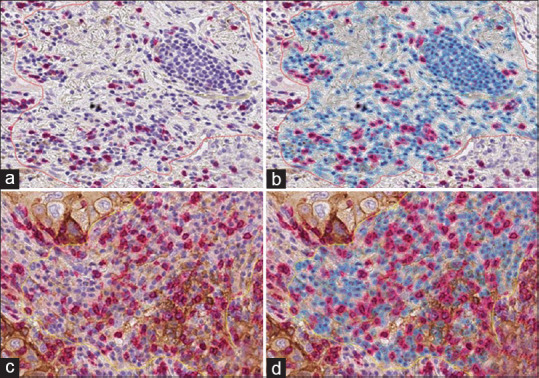
Illustration of digital image analysis workflow applied to a region of interest in a PD-L1/CD8 dual stain slide image. Cells are color-coded by classification: red (stroma, CD8+), blue (stroma, CD8-), and gray (artifact). Examples of cases where concordance between pathologists and QuPath is high (a and b) and low (c and d)