. 2021 Mar 9;12(8):3657–3671. doi: 10.1039/d0fo02867c

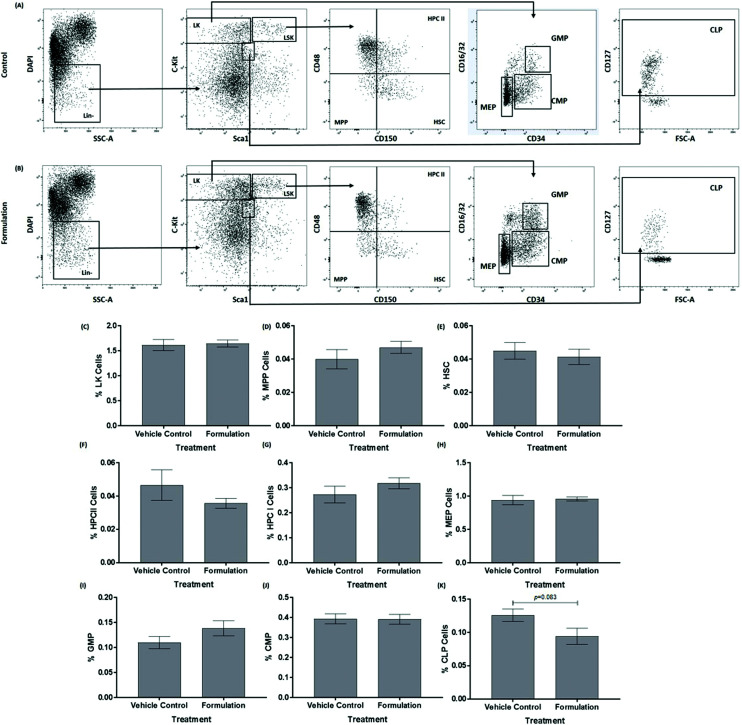
Fig. 2. The effect of the formulation on hematopoietic stem and progenitor cells within the bone marrow. Cell populations were assessed in the bone marrow of mice after 21 days of a HFD and treatment with either a vehicle control (A) or the formulation (B). Representative flow cytometry plots of hematopoietic stem and progenitor cells in the bone marrow are presented (A and B). The bar graphs show the frequency of LK cells (C), MPP cells (D), HSC cells (E), HPCII cells (F), HPCI cells (G), MEP cells (H), GMP cells (I), CMP cells (J) and CLP cells (K) in the bone marrow. The data in graphs are mean ± SEM from six control and seven formulation treated mice (the various cell populations represent only a small proportion of starting cells). Statistical analysis was performed using an unpaired Student's t-test (C, D, E, G, H, I, J, K) or Mann–Whitney U test (F) and p values are stated where appropriate. Abbreviations: CLP, common lymphoid progenitor; CMP, common myeloid progenitor; GMP, granulocyte–macrophage progenitor; HPC, hematopoietic progenitor cell; HSC, hematopoietic stem cells; LK, Lin c-Kit+ cells; MEP, megakaryocyte-erythroid progenitor; MPP, multipotent progenitors.

Fig. 2