. 2021 Mar 9;12(8):3657–3671. doi: 10.1039/d0fo02867c

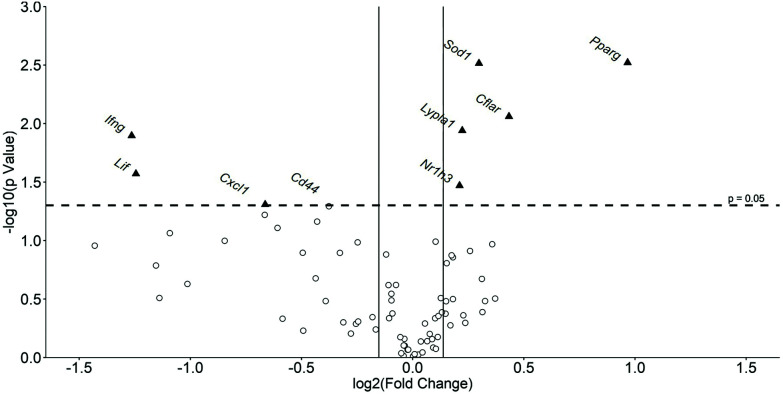
Fig. 3. Volcano plot showing global gene expression changes in the liver of mice fed a HFD and treated with the formulation or vehicle control. Gene transcript levels of 84 genes were assessed in the livers of mice after 21 days of a HFD and treatment with either a vehicle control or the formulation. The data are presented as the mean formulation induced fold change when compared to the vehicle control treated mice. All genes present on the Qiagen RT2 profiler PCR Array were plotted. The log fold change following the treatment vs. the vehicle control cells is represented on the x-axis. The y-axis shows the –log 10 of the p value. A p value of 0.05 (dashed line) and a fold changes of ±10% (solid lines) are indicated. Genes whose expression was significantly altered by the formulation are indicated by a black triangle. Abbreviations: Cd44, CD44 antigen; Cflar, CASP8 and FADD-like apoptosis regulator; Cxcl1, Chemokine (C–X–C motif) ligand 1; Ifng, interferon-γ; Lif, leukemia inhibitory factor; Lypla1, lysophospholipase 1; Nr1h3, nuclear receptor subfamily 1; Pparg, peroxisome proliferator activator receptor-γ; Sod1, superoxide dismutase 1.

Fig. 3