Figure 1.

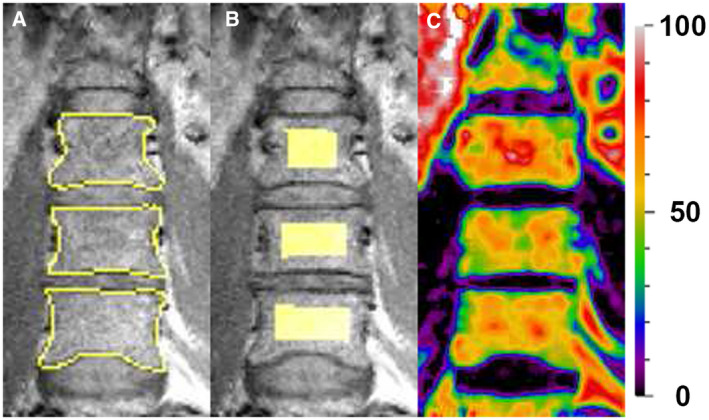
(A) Outline of vertebral bodies L3‐L5. (B) Region of interest derived from the outline of the vertebral bodies L3‐L5. (C) Fatsignalfraction map with color coding ranging from 0% fat to 100% fat.

(A) Outline of vertebral bodies L3‐L5. (B) Region of interest derived from the outline of the vertebral bodies L3‐L5. (C) Fatsignalfraction map with color coding ranging from 0% fat to 100% fat.