
Figure 1: Major cell types in healthy adult oral mucosal tissues.
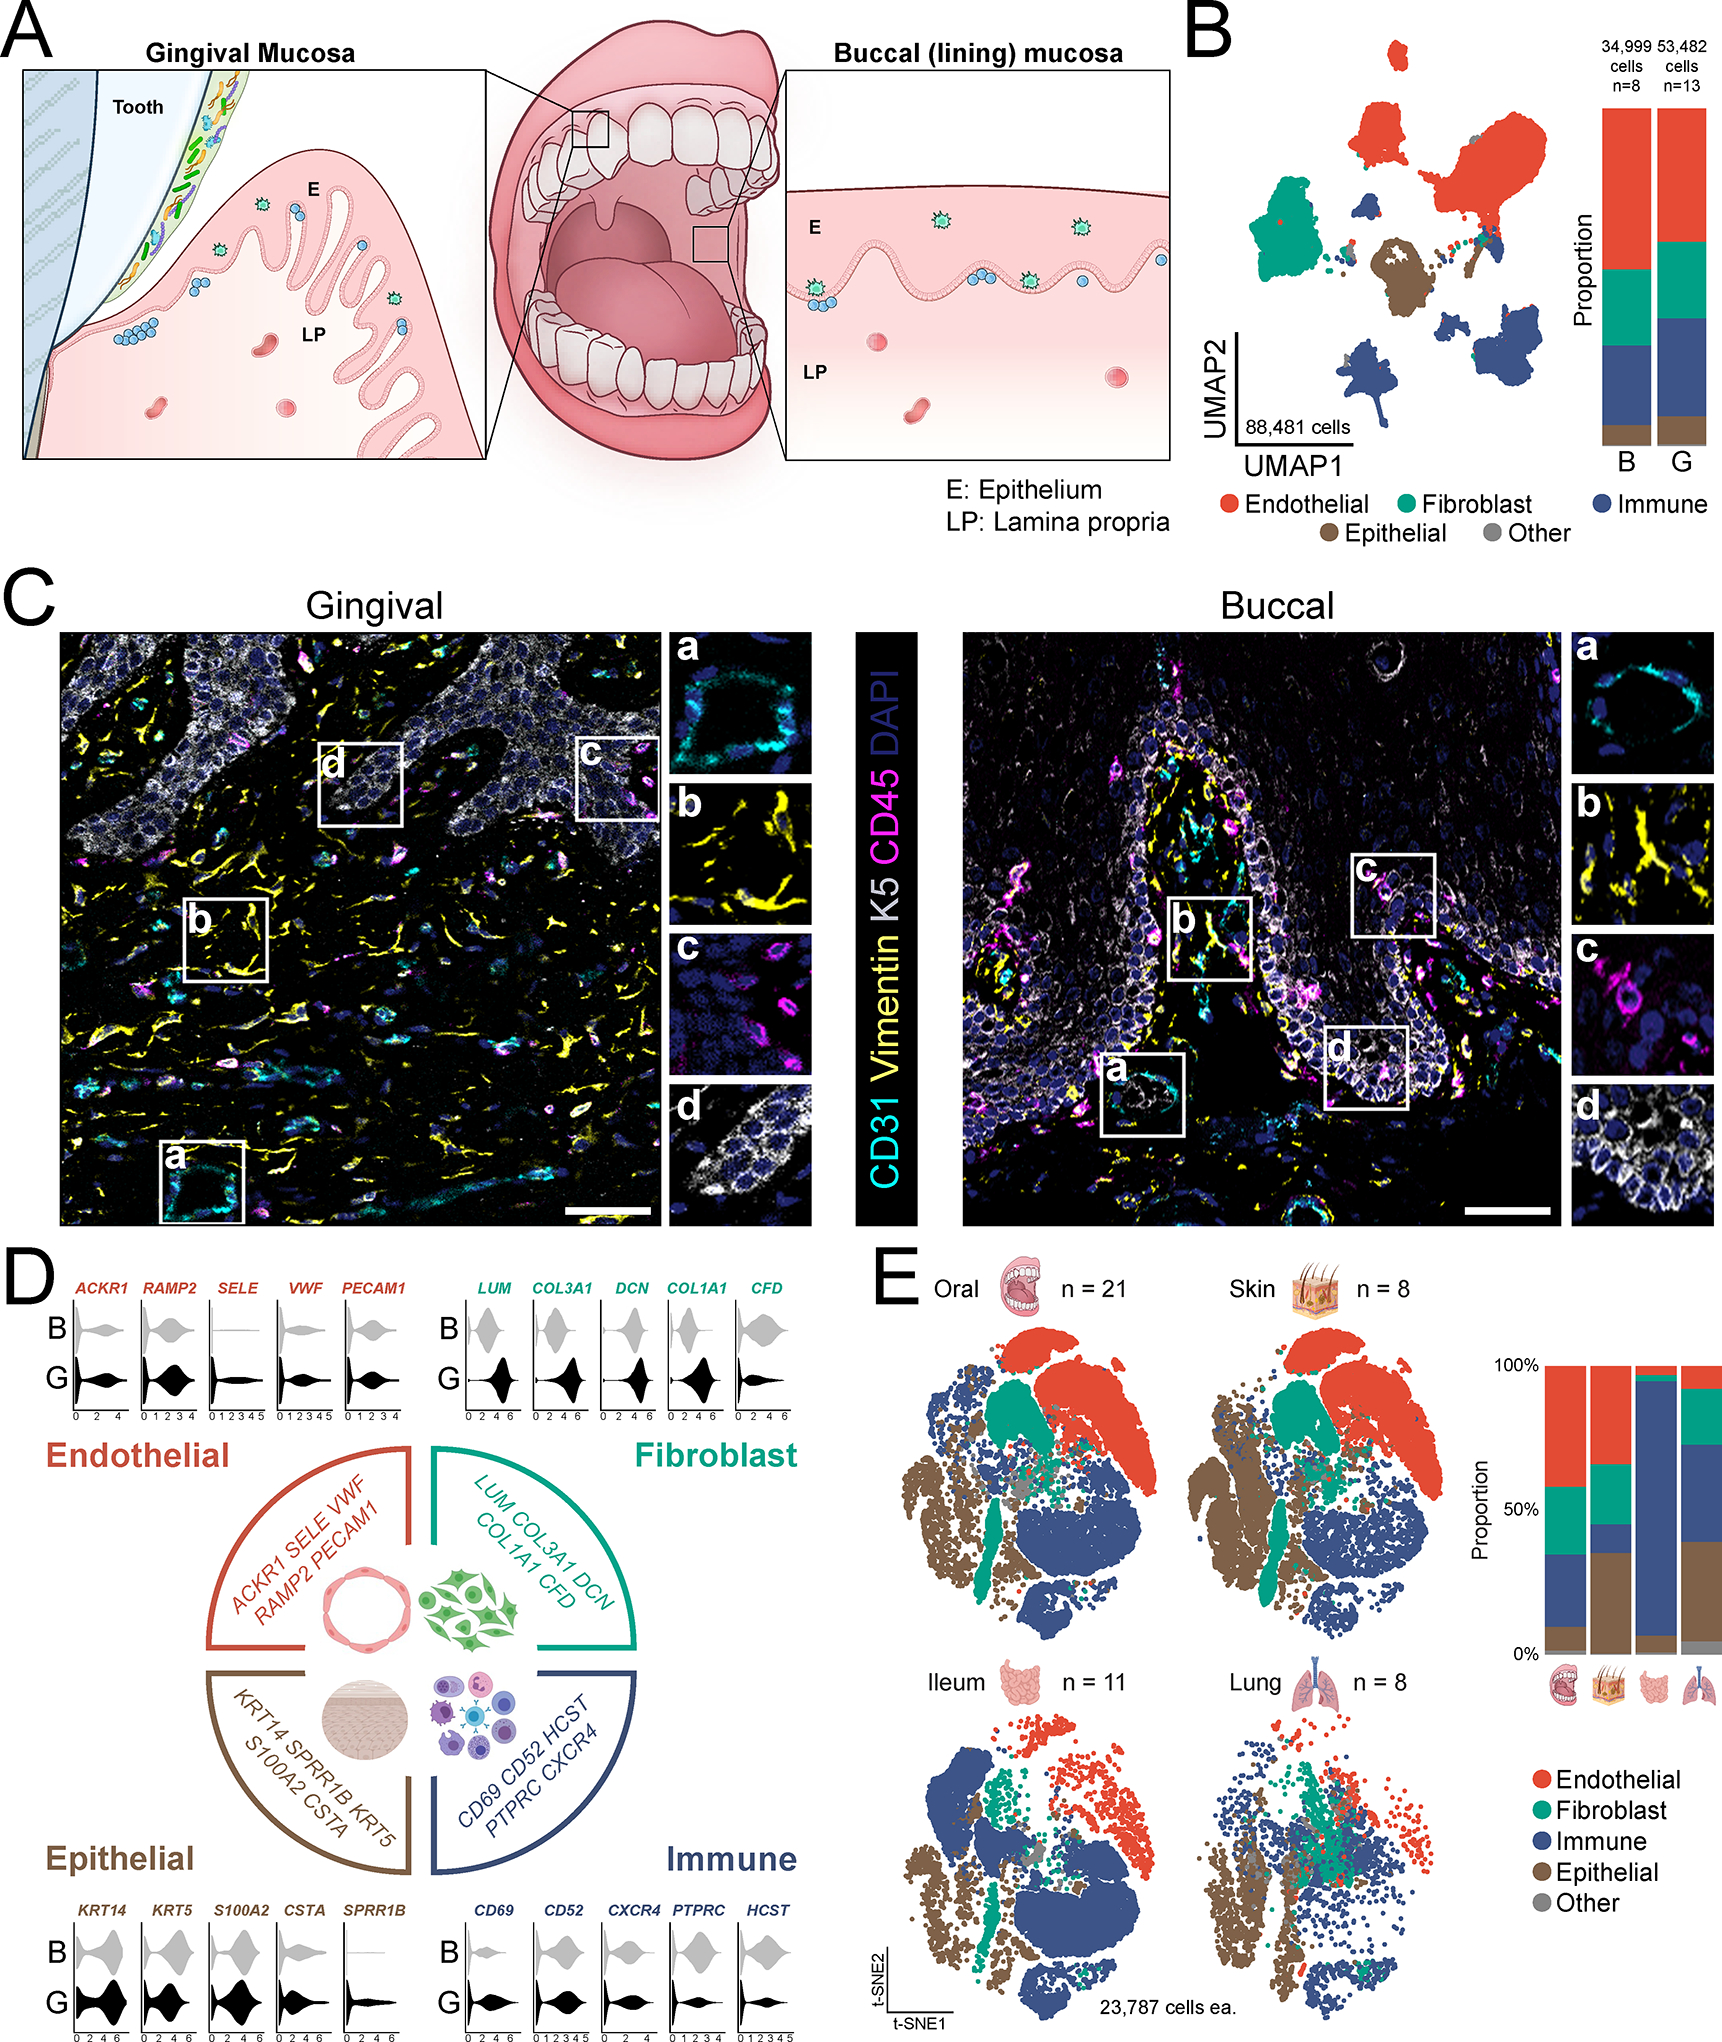
A. Schematic of the oral mucosal tissues biopsied with locations indicated (E-epithelium, LP- lamina propria). B. UMAP representation of major cell types identified by scRNA seq (n=21, 88,481 cells, left) and bar graph of relative cell proportions by tissue type (B-buccal, G-gingival) (right). C. Immunofluorescence depicting major cell types in healthy gingival and buccal mucosa. Scale bar: 41 μm. Stains indicated and color coded. D. Violin plots of selected markers for major cell populations and relative expression per tissue type. X-axis represents normalized average expression. E. t-SNE (left) and proportion plots (right) showing representation of major cell types in oral (n=21), skin (n=8), ileum (n=11), and lung (n=8) barrier tissues. All datasets were truncated to ensure equal number of cells (23,787) were compared. See also Table S1–S3, Figure S1.